Celtic vs Soviet Union Female Unemployment
COMPARE
Celtic
Soviet Union
Female Unemployment
Female Unemployment Comparison
Celtics
Soviet Union
4.9%
FEMALE UNEMPLOYMENT
98.5/ 100
METRIC RATING
64th/ 347
METRIC RANK
5.4%
FEMALE UNEMPLOYMENT
21.7/ 100
METRIC RATING
200th/ 347
METRIC RANK
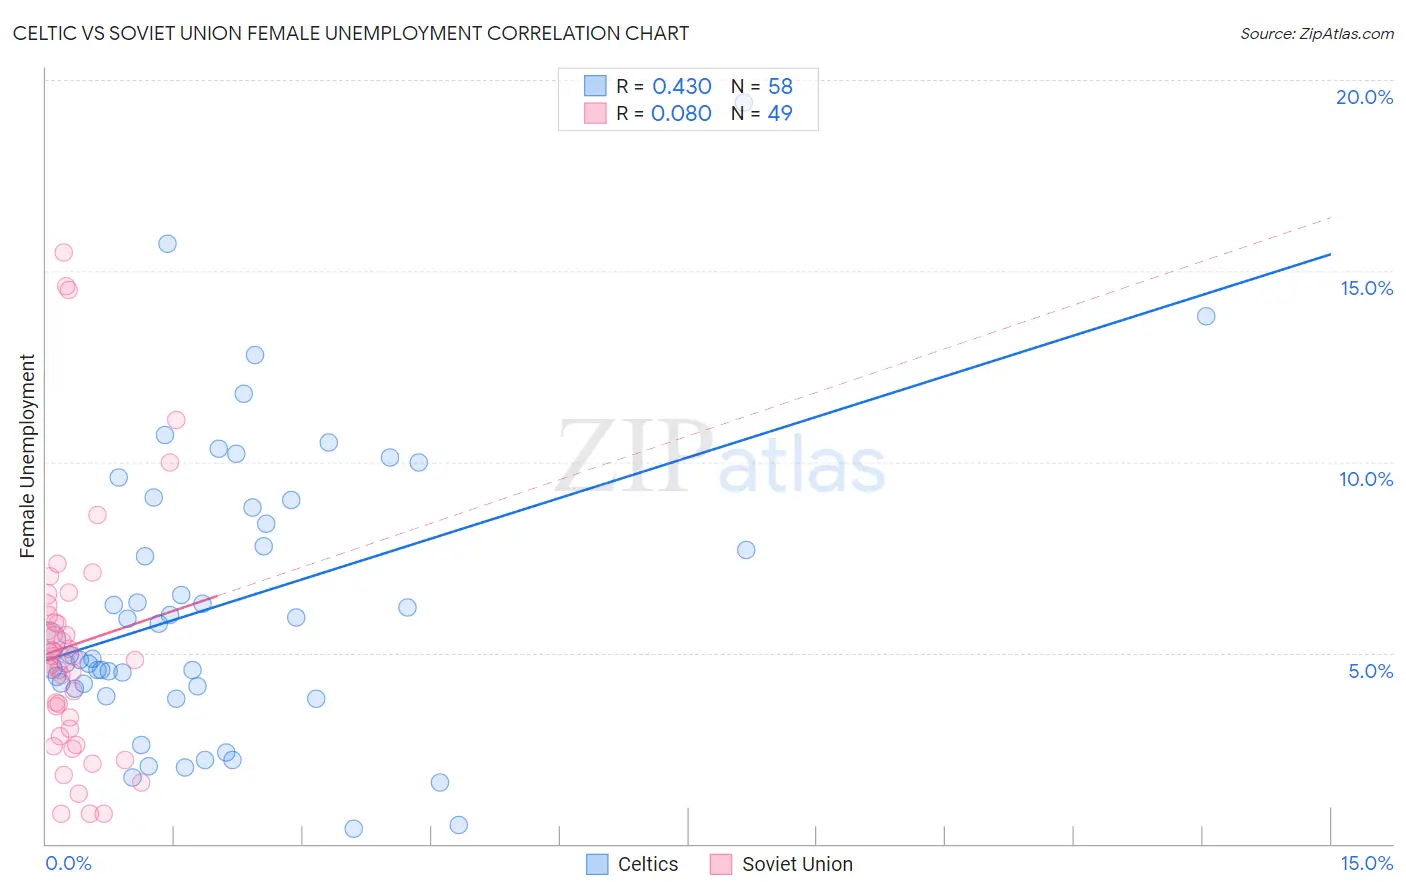
Celtic vs Soviet Union Female Unemployment Correlation Chart
The statistical analysis conducted on geographies consisting of 168,426,082 people shows a moderate positive correlation between the proportion of Celtics and unemploymnet rate among females in the United States with a correlation coefficient (R) of 0.430 and weighted average of 4.9%. Similarly, the statistical analysis conducted on geographies consisting of 43,498,217 people shows a slight positive correlation between the proportion of Soviet Union and unemploymnet rate among females in the United States with a correlation coefficient (R) of 0.080 and weighted average of 5.4%, a difference of 8.7%.
Female Unemployment Correlation Summary
| Measurement | Celtic | Soviet Union |
| Minimum | 0.40% | 0.80% |
| Maximum | 19.4% | 15.5% |
| Range | 19.0% | 14.7% |
| Mean | 6.3% | 5.2% |
| Median | 5.1% | 4.9% |
| Interquartile 25% (IQ1) | 4.1% | 2.9% |
| Interquartile 75% (IQ3) | 8.8% | 6.1% |
| Interquartile Range (IQR) | 4.7% | 3.2% |
| Standard Deviation (Sample) | 3.8% | 3.3% |
| Standard Deviation (Population) | 3.7% | 3.3% |
Similar Demographics by Female Unemployment
Demographics Similar to Celtics by Female Unemployment
In terms of female unemployment, the demographic groups most similar to Celtics are Immigrants from Belgium (4.9%, a difference of 0.0%), Immigrants from Canada (4.9%, a difference of 0.12%), Immigrants from Nepal (4.9%, a difference of 0.12%), Immigrants from Scotland (4.9%, a difference of 0.13%), and Immigrants from North America (4.9%, a difference of 0.19%).
| Demographics | Rating | Rank | Female Unemployment |
| Icelanders | 98.8 /100 | #57 | Exceptional 4.9% |
| Immigrants | Lithuania | 98.8 /100 | #58 | Exceptional 4.9% |
| Bhutanese | 98.7 /100 | #59 | Exceptional 4.9% |
| Immigrants | Scotland | 98.6 /100 | #60 | Exceptional 4.9% |
| Immigrants | Canada | 98.6 /100 | #61 | Exceptional 4.9% |
| Immigrants | Nepal | 98.6 /100 | #62 | Exceptional 4.9% |
| Immigrants | Belgium | 98.5 /100 | #63 | Exceptional 4.9% |
| Celtics | 98.5 /100 | #64 | Exceptional 4.9% |
| Immigrants | North America | 98.3 /100 | #65 | Exceptional 4.9% |
| Hungarians | 98.3 /100 | #66 | Exceptional 4.9% |
| Cubans | 98.3 /100 | #67 | Exceptional 4.9% |
| Tlingit-Haida | 98.3 /100 | #68 | Exceptional 4.9% |
| Immigrants | Ireland | 98.2 /100 | #69 | Exceptional 4.9% |
| Osage | 98.2 /100 | #70 | Exceptional 4.9% |
| German Russians | 98.1 /100 | #71 | Exceptional 4.9% |
Demographics Similar to Soviet Union by Female Unemployment
In terms of female unemployment, the demographic groups most similar to Soviet Union are Hawaiian (5.4%, a difference of 0.040%), Immigrants from Middle Africa (5.4%, a difference of 0.080%), Iroquois (5.4%, a difference of 0.080%), Tsimshian (5.4%, a difference of 0.12%), and Immigrants from South Eastern Asia (5.4%, a difference of 0.12%).
| Demographics | Rating | Rank | Female Unemployment |
| Arabs | 27.7 /100 | #193 | Fair 5.3% |
| Colombians | 27.0 /100 | #194 | Fair 5.3% |
| Immigrants | Colombia | 26.2 /100 | #195 | Fair 5.3% |
| Spaniards | 25.2 /100 | #196 | Fair 5.3% |
| Alsatians | 23.9 /100 | #197 | Fair 5.3% |
| Tsimshian | 23.1 /100 | #198 | Fair 5.4% |
| Hawaiians | 22.2 /100 | #199 | Fair 5.4% |
| Soviet Union | 21.7 /100 | #200 | Fair 5.4% |
| Immigrants | Middle Africa | 20.8 /100 | #201 | Fair 5.4% |
| Iroquois | 20.8 /100 | #202 | Fair 5.4% |
| Immigrants | South Eastern Asia | 20.3 /100 | #203 | Fair 5.4% |
| Immigrants | Israel | 19.7 /100 | #204 | Poor 5.4% |
| Immigrants | Afghanistan | 18.9 /100 | #205 | Poor 5.4% |
| Immigrants | Brazil | 18.8 /100 | #206 | Poor 5.4% |
| Creek | 15.4 /100 | #207 | Poor 5.4% |