Cape Verdean vs Ugandan Unemployment
COMPARE
Cape Verdean
Ugandan
Unemployment
Unemployment Comparison
Cape Verdeans
Ugandans
6.5%
UNEMPLOYMENT
0.0/ 100
METRIC RATING
311th/ 347
METRIC RANK
5.4%
UNEMPLOYMENT
18.0/ 100
METRIC RATING
212th/ 347
METRIC RANK
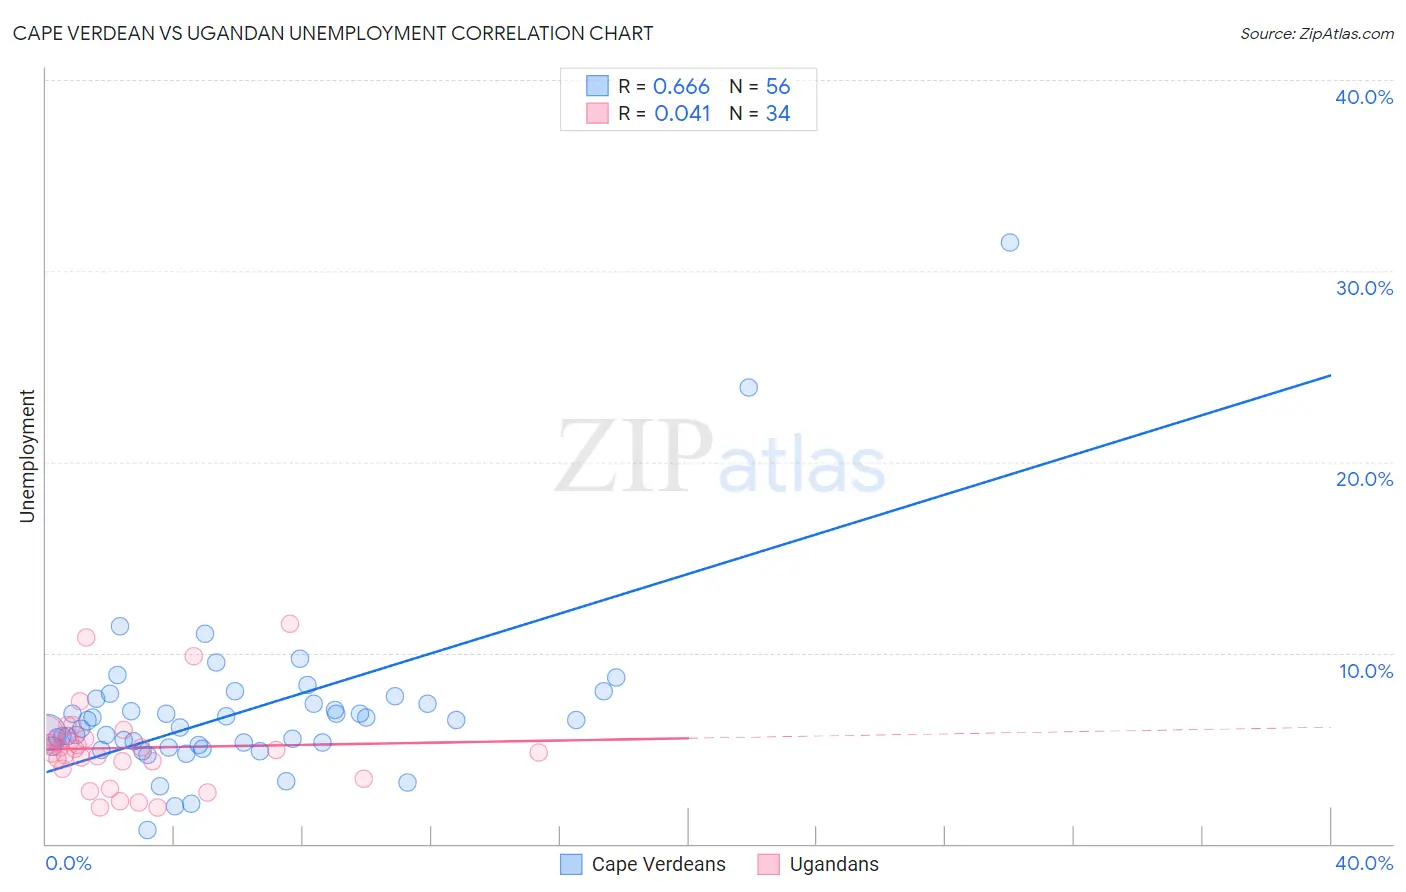
Cape Verdean vs Ugandan Unemployment Correlation Chart
The statistical analysis conducted on geographies consisting of 107,538,461 people shows a significant positive correlation between the proportion of Cape Verdeans and unemployment in the United States with a correlation coefficient (R) of 0.666 and weighted average of 6.5%. Similarly, the statistical analysis conducted on geographies consisting of 94,004,444 people shows no correlation between the proportion of Ugandans and unemployment in the United States with a correlation coefficient (R) of 0.041 and weighted average of 5.4%, a difference of 21.4%.
Unemployment Correlation Summary
| Measurement | Cape Verdean | Ugandan |
| Minimum | 0.70% | 1.9% |
| Maximum | 31.5% | 11.5% |
| Range | 30.8% | 9.6% |
| Mean | 6.9% | 5.0% |
| Median | 6.3% | 4.8% |
| Interquartile 25% (IQ1) | 5.1% | 3.9% |
| Interquartile 75% (IQ3) | 7.5% | 5.5% |
| Interquartile Range (IQR) | 2.3% | 1.6% |
| Standard Deviation (Sample) | 4.6% | 2.2% |
| Standard Deviation (Population) | 4.5% | 2.2% |
Similar Demographics by Unemployment
Demographics Similar to Cape Verdeans by Unemployment
In terms of unemployment, the demographic groups most similar to Cape Verdeans are Immigrants from Belize (6.5%, a difference of 0.33%), Colville (6.6%, a difference of 0.57%), Vietnamese (6.5%, a difference of 0.60%), Barbadian (6.5%, a difference of 0.61%), and Immigrants from Barbados (6.6%, a difference of 0.95%).
| Demographics | Rating | Rank | Unemployment |
| Immigrants | Jamaica | 0.0 /100 | #304 | Tragic 6.4% |
| Menominee | 0.0 /100 | #305 | Tragic 6.4% |
| Lumbee | 0.0 /100 | #306 | Tragic 6.4% |
| Immigrants | Bangladesh | 0.0 /100 | #307 | Tragic 6.5% |
| Barbadians | 0.0 /100 | #308 | Tragic 6.5% |
| Vietnamese | 0.0 /100 | #309 | Tragic 6.5% |
| Immigrants | Belize | 0.0 /100 | #310 | Tragic 6.5% |
| Cape Verdeans | 0.0 /100 | #311 | Tragic 6.5% |
| Colville | 0.0 /100 | #312 | Tragic 6.6% |
| Immigrants | Barbados | 0.0 /100 | #313 | Tragic 6.6% |
| Blacks/African Americans | 0.0 /100 | #314 | Tragic 6.6% |
| Houma | 0.0 /100 | #315 | Tragic 6.7% |
| Immigrants | Dominica | 0.0 /100 | #316 | Tragic 6.7% |
| Shoshone | 0.0 /100 | #317 | Tragic 6.8% |
| Immigrants | Cabo Verde | 0.0 /100 | #318 | Tragic 6.8% |
Demographics Similar to Ugandans by Unemployment
In terms of unemployment, the demographic groups most similar to Ugandans are Iraqi (5.4%, a difference of 0.010%), Immigrants from Iraq (5.4%, a difference of 0.060%), Immigrants from Iran (5.4%, a difference of 0.080%), Portuguese (5.4%, a difference of 0.11%), and Creek (5.4%, a difference of 0.14%).
| Demographics | Rating | Rank | Unemployment |
| Native Hawaiians | 24.1 /100 | #205 | Fair 5.3% |
| Immigrants | Peru | 22.7 /100 | #206 | Fair 5.4% |
| Creek | 19.4 /100 | #207 | Poor 5.4% |
| Portuguese | 19.0 /100 | #208 | Poor 5.4% |
| Immigrants | Iran | 18.8 /100 | #209 | Poor 5.4% |
| Immigrants | Iraq | 18.6 /100 | #210 | Poor 5.4% |
| Iraqis | 18.1 /100 | #211 | Poor 5.4% |
| Ugandans | 18.0 /100 | #212 | Poor 5.4% |
| Immigrants | Middle Africa | 15.3 /100 | #213 | Poor 5.4% |
| Immigrants | Costa Rica | 15.2 /100 | #214 | Poor 5.4% |
| Delaware | 14.7 /100 | #215 | Poor 5.4% |
| Immigrants | South America | 13.5 /100 | #216 | Poor 5.4% |
| Immigrants | Albania | 13.5 /100 | #217 | Poor 5.4% |
| Choctaw | 12.7 /100 | #218 | Poor 5.4% |
| Bangladeshis | 11.2 /100 | #219 | Poor 5.4% |