Cambodian vs Immigrants from Israel Male Unemployment
COMPARE
Cambodian
Immigrants from Israel
Male Unemployment
Male Unemployment Comparison
Cambodians
Immigrants from Israel
5.0%
MALE UNEMPLOYMENT
98.1/ 100
METRIC RATING
61st/ 347
METRIC RANK
5.4%
MALE UNEMPLOYMENT
25.2/ 100
METRIC RATING
193rd/ 347
METRIC RANK
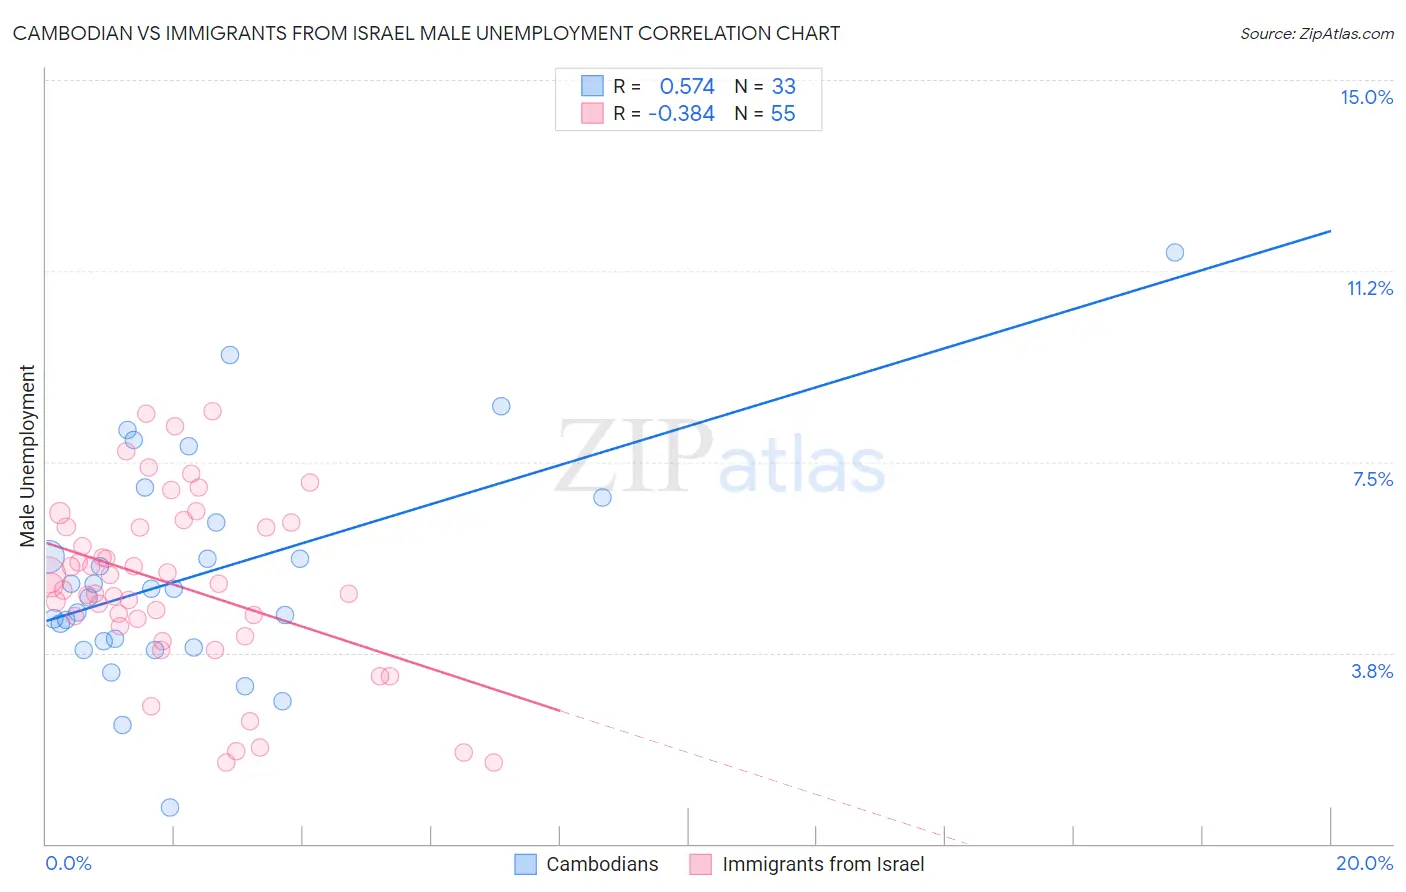
Cambodian vs Immigrants from Israel Male Unemployment Correlation Chart
The statistical analysis conducted on geographies consisting of 102,427,850 people shows a substantial positive correlation between the proportion of Cambodians and unemployment rate among males in the United States with a correlation coefficient (R) of 0.574 and weighted average of 5.0%. Similarly, the statistical analysis conducted on geographies consisting of 209,695,257 people shows a mild negative correlation between the proportion of Immigrants from Israel and unemployment rate among males in the United States with a correlation coefficient (R) of -0.384 and weighted average of 5.4%, a difference of 7.7%.
Male Unemployment Correlation Summary
| Measurement | Cambodian | Immigrants from Israel |
| Minimum | 0.70% | 1.6% |
| Maximum | 11.6% | 8.5% |
| Range | 10.9% | 6.9% |
| Mean | 5.3% | 5.1% |
| Median | 5.0% | 5.1% |
| Interquartile 25% (IQ1) | 3.9% | 4.3% |
| Interquartile 75% (IQ3) | 6.6% | 6.2% |
| Interquartile Range (IQR) | 2.6% | 2.0% |
| Standard Deviation (Sample) | 2.2% | 1.7% |
| Standard Deviation (Population) | 2.2% | 1.7% |
Similar Demographics by Male Unemployment
Demographics Similar to Cambodians by Male Unemployment
In terms of male unemployment, the demographic groups most similar to Cambodians are Immigrants from Argentina (5.0%, a difference of 0.080%), Basque (5.0%, a difference of 0.13%), Eastern European (5.0%, a difference of 0.14%), Celtic (5.0%, a difference of 0.16%), and Immigrants from Netherlands (5.0%, a difference of 0.26%).
| Demographics | Rating | Rank | Male Unemployment |
| Yugoslavians | 98.7 /100 | #54 | Exceptional 5.0% |
| Czechoslovakians | 98.7 /100 | #55 | Exceptional 5.0% |
| Immigrants | Bulgaria | 98.7 /100 | #56 | Exceptional 5.0% |
| Turks | 98.5 /100 | #57 | Exceptional 5.0% |
| Lithuanians | 98.5 /100 | #58 | Exceptional 5.0% |
| Immigrants | Netherlands | 98.3 /100 | #59 | Exceptional 5.0% |
| Immigrants | Argentina | 98.1 /100 | #60 | Exceptional 5.0% |
| Cambodians | 98.1 /100 | #61 | Exceptional 5.0% |
| Basques | 97.9 /100 | #62 | Exceptional 5.0% |
| Eastern Europeans | 97.9 /100 | #63 | Exceptional 5.0% |
| Celtics | 97.8 /100 | #64 | Exceptional 5.0% |
| Icelanders | 97.6 /100 | #65 | Exceptional 5.0% |
| Finns | 97.5 /100 | #66 | Exceptional 5.0% |
| Immigrants | Canada | 97.5 /100 | #67 | Exceptional 5.0% |
| Australians | 97.4 /100 | #68 | Exceptional 5.0% |
Demographics Similar to Immigrants from Israel by Male Unemployment
In terms of male unemployment, the demographic groups most similar to Immigrants from Israel are Immigrants from Belarus (5.4%, a difference of 0.060%), Immigrants from South Eastern Asia (5.4%, a difference of 0.22%), Immigrants from Uganda (5.4%, a difference of 0.26%), Immigrants from South America (5.4%, a difference of 0.30%), and Arab (5.4%, a difference of 0.36%).
| Demographics | Rating | Rank | Male Unemployment |
| Iraqis | 31.6 /100 | #186 | Fair 5.4% |
| Costa Ricans | 31.3 /100 | #187 | Fair 5.4% |
| Arabs | 30.2 /100 | #188 | Fair 5.4% |
| Immigrants | South America | 29.4 /100 | #189 | Fair 5.4% |
| Immigrants | Uganda | 28.8 /100 | #190 | Fair 5.4% |
| Immigrants | South Eastern Asia | 28.2 /100 | #191 | Fair 5.4% |
| Immigrants | Belarus | 26.0 /100 | #192 | Fair 5.4% |
| Immigrants | Israel | 25.2 /100 | #193 | Fair 5.4% |
| Spanish | 19.7 /100 | #194 | Poor 5.4% |
| Immigrants | Southern Europe | 17.7 /100 | #195 | Poor 5.4% |
| Albanians | 17.3 /100 | #196 | Poor 5.4% |
| Alsatians | 16.7 /100 | #197 | Poor 5.4% |
| Immigrants | Thailand | 14.7 /100 | #198 | Poor 5.4% |
| Immigrants | Greece | 14.5 /100 | #199 | Poor 5.4% |
| Immigrants | Zaire | 13.7 /100 | #200 | Poor 5.4% |