South American vs Colombian Female Unemployment
COMPARE
South American
Colombian
Female Unemployment
Female Unemployment Comparison
South Americans
Colombians
5.4%
FEMALE UNEMPLOYMENT
8.6/ 100
METRIC RATING
219th/ 347
METRIC RANK
5.3%
FEMALE UNEMPLOYMENT
27.0/ 100
METRIC RATING
194th/ 347
METRIC RANK
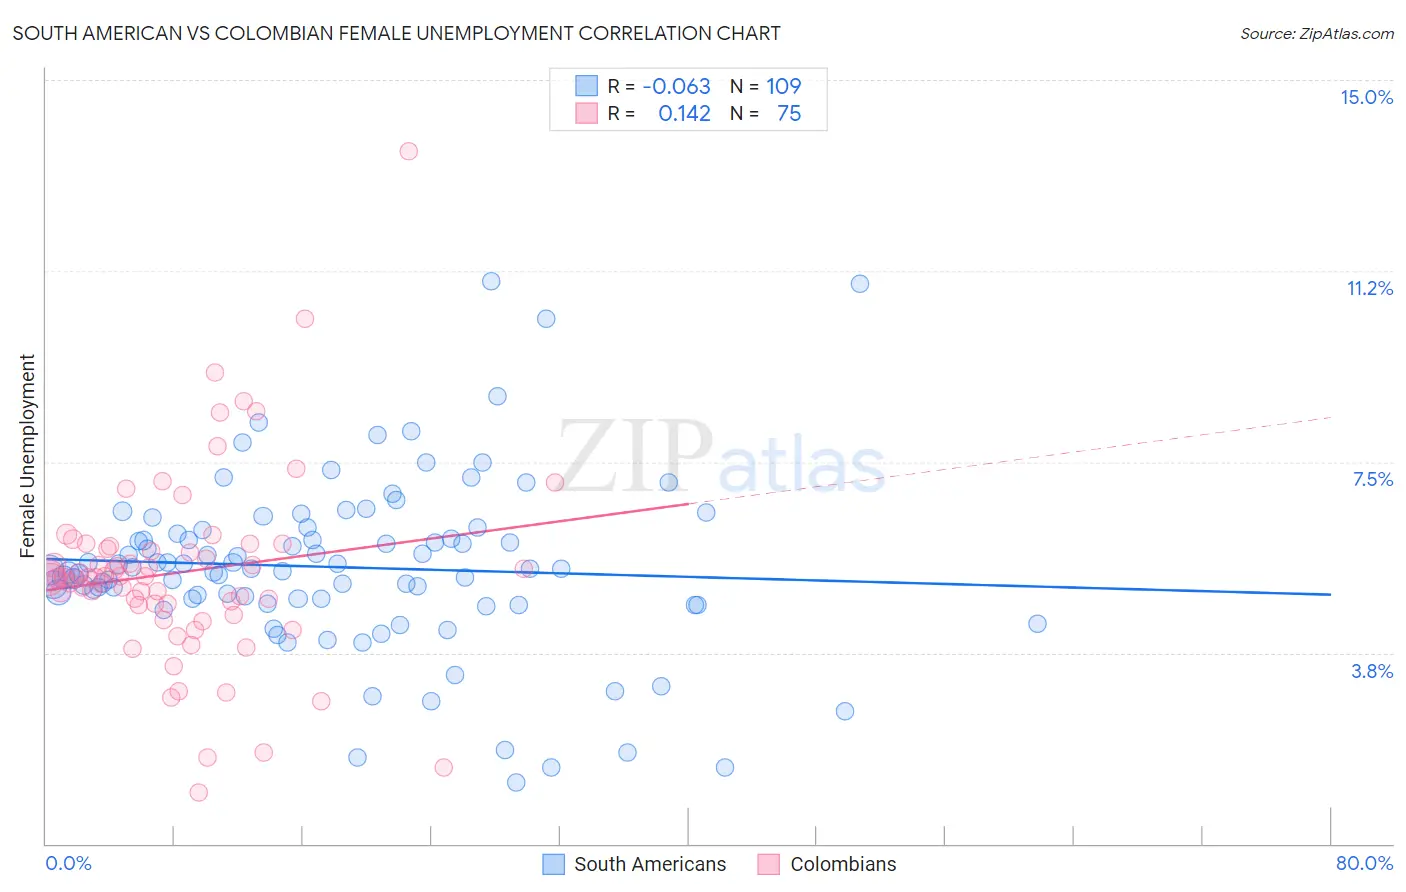
South American vs Colombian Female Unemployment Correlation Chart
The statistical analysis conducted on geographies consisting of 490,205,488 people shows a slight negative correlation between the proportion of South Americans and unemploymnet rate among females in the United States with a correlation coefficient (R) of -0.063 and weighted average of 5.4%. Similarly, the statistical analysis conducted on geographies consisting of 417,884,400 people shows a poor positive correlation between the proportion of Colombians and unemploymnet rate among females in the United States with a correlation coefficient (R) of 0.142 and weighted average of 5.3%, a difference of 2.0%.
Female Unemployment Correlation Summary
| Measurement | South American | Colombian |
| Minimum | 1.2% | 1.0% |
| Maximum | 11.0% | 13.6% |
| Range | 9.8% | 12.6% |
| Mean | 5.4% | 5.3% |
| Median | 5.4% | 5.2% |
| Interquartile 25% (IQ1) | 4.8% | 4.7% |
| Interquartile 75% (IQ3) | 6.1% | 5.8% |
| Interquartile Range (IQR) | 1.4% | 1.2% |
| Standard Deviation (Sample) | 1.7% | 1.9% |
| Standard Deviation (Population) | 1.7% | 1.9% |
Similar Demographics by Female Unemployment
Demographics Similar to South Americans by Female Unemployment
In terms of female unemployment, the demographic groups most similar to South Americans are Immigrants from Africa (5.4%, a difference of 0.010%), Bermudan (5.4%, a difference of 0.070%), Peruvian (5.4%, a difference of 0.17%), Comanche (5.4%, a difference of 0.24%), and Brazilian (5.5%, a difference of 0.26%).
| Demographics | Rating | Rank | Female Unemployment |
| Uruguayans | 11.4 /100 | #212 | Poor 5.4% |
| Samoans | 10.6 /100 | #213 | Poor 5.4% |
| Seminole | 10.3 /100 | #214 | Poor 5.4% |
| Immigrants | Nicaragua | 10.2 /100 | #215 | Poor 5.4% |
| Comanche | 10.0 /100 | #216 | Poor 5.4% |
| Peruvians | 9.6 /100 | #217 | Tragic 5.4% |
| Bermudans | 9.0 /100 | #218 | Tragic 5.4% |
| South Americans | 8.6 /100 | #219 | Tragic 5.4% |
| Immigrants | Africa | 8.5 /100 | #220 | Tragic 5.4% |
| Brazilians | 7.3 /100 | #221 | Tragic 5.5% |
| Nicaraguans | 7.2 /100 | #222 | Tragic 5.5% |
| Delaware | 7.2 /100 | #223 | Tragic 5.5% |
| Iraqis | 7.1 /100 | #224 | Tragic 5.5% |
| French American Indians | 6.1 /100 | #225 | Tragic 5.5% |
| Immigrants | Peru | 5.9 /100 | #226 | Tragic 5.5% |
Demographics Similar to Colombians by Female Unemployment
In terms of female unemployment, the demographic groups most similar to Colombians are Arab (5.3%, a difference of 0.050%), Immigrants from Colombia (5.3%, a difference of 0.060%), Portuguese (5.3%, a difference of 0.12%), Spaniard (5.3%, a difference of 0.14%), and Alsatian (5.3%, a difference of 0.24%).
| Demographics | Rating | Rank | Female Unemployment |
| Immigrants | Albania | 35.4 /100 | #187 | Fair 5.3% |
| Afghans | 33.9 /100 | #188 | Fair 5.3% |
| Costa Ricans | 33.8 /100 | #189 | Fair 5.3% |
| Ugandans | 31.2 /100 | #190 | Fair 5.3% |
| Cherokee | 30.8 /100 | #191 | Fair 5.3% |
| Portuguese | 28.6 /100 | #192 | Fair 5.3% |
| Arabs | 27.7 /100 | #193 | Fair 5.3% |
| Colombians | 27.0 /100 | #194 | Fair 5.3% |
| Immigrants | Colombia | 26.2 /100 | #195 | Fair 5.3% |
| Spaniards | 25.2 /100 | #196 | Fair 5.3% |
| Alsatians | 23.9 /100 | #197 | Fair 5.3% |
| Tsimshian | 23.1 /100 | #198 | Fair 5.4% |
| Hawaiians | 22.2 /100 | #199 | Fair 5.4% |
| Soviet Union | 21.7 /100 | #200 | Fair 5.4% |
| Immigrants | Middle Africa | 20.8 /100 | #201 | Fair 5.4% |