Immigrants from Latin America vs Bahamian Female Unemployment
COMPARE
Immigrants from Latin America
Bahamian
Female Unemployment
Female Unemployment Comparison
Immigrants from Latin America
Bahamians
6.1%
FEMALE UNEMPLOYMENT
0.0/ 100
METRIC RATING
295th/ 347
METRIC RANK
6.0%
FEMALE UNEMPLOYMENT
0.0/ 100
METRIC RATING
276th/ 347
METRIC RANK
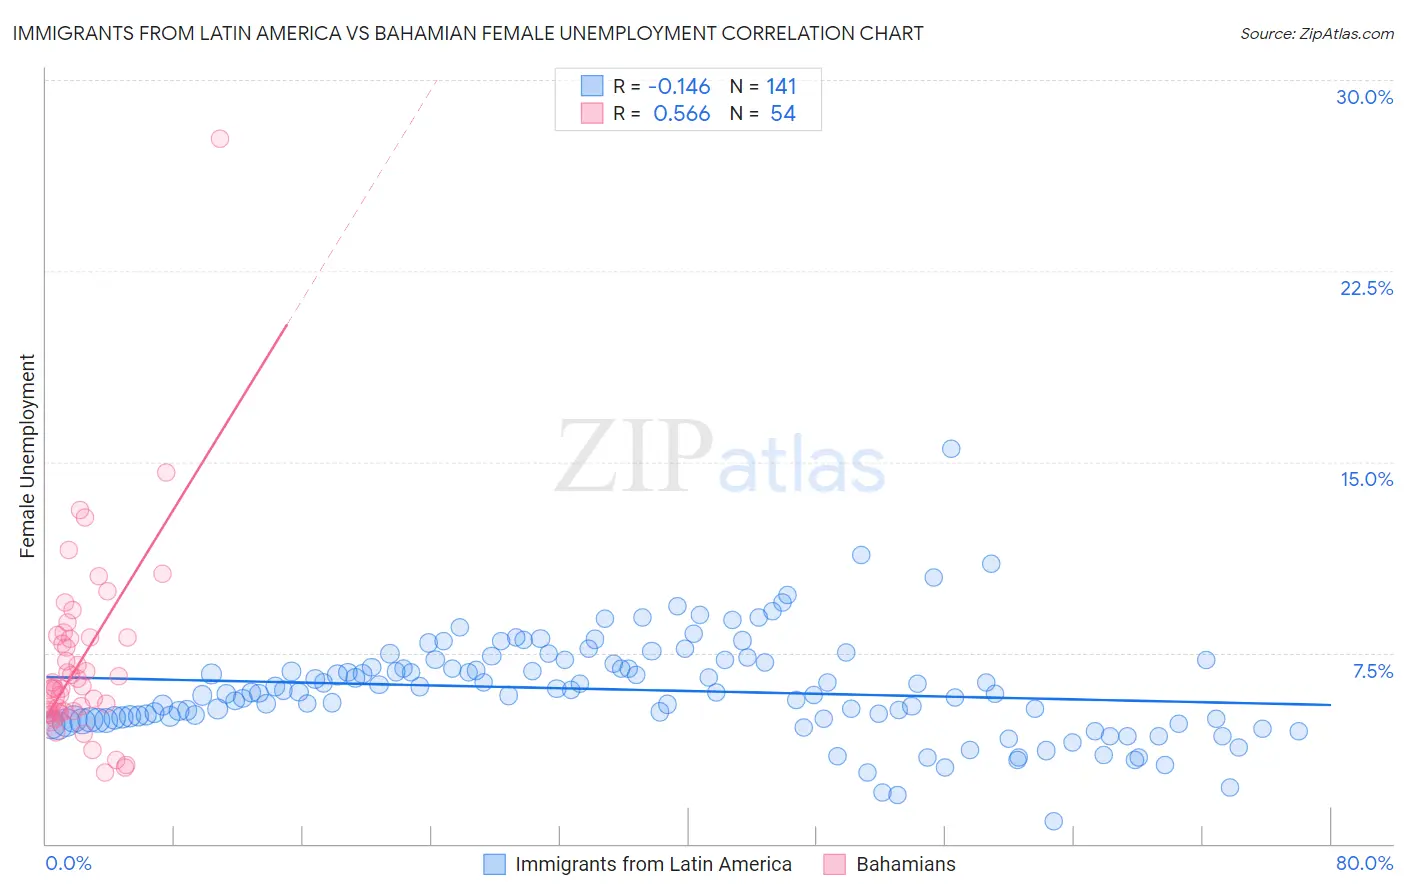
Immigrants from Latin America vs Bahamian Female Unemployment Correlation Chart
The statistical analysis conducted on geographies consisting of 548,551,926 people shows a poor negative correlation between the proportion of Immigrants from Latin America and unemploymnet rate among females in the United States with a correlation coefficient (R) of -0.146 and weighted average of 6.1%. Similarly, the statistical analysis conducted on geographies consisting of 112,545,227 people shows a substantial positive correlation between the proportion of Bahamians and unemploymnet rate among females in the United States with a correlation coefficient (R) of 0.566 and weighted average of 6.0%, a difference of 2.3%.
Female Unemployment Correlation Summary
| Measurement | Immigrants from Latin America | Bahamian |
| Minimum | 0.90% | 2.8% |
| Maximum | 15.5% | 27.7% |
| Range | 14.6% | 24.9% |
| Mean | 6.1% | 7.2% |
| Median | 6.0% | 6.2% |
| Interquartile 25% (IQ1) | 4.9% | 5.2% |
| Interquartile 75% (IQ3) | 7.2% | 8.1% |
| Interquartile Range (IQR) | 2.3% | 2.9% |
| Standard Deviation (Sample) | 2.0% | 3.8% |
| Standard Deviation (Population) | 2.0% | 3.8% |
Demographics Similar to Immigrants from Latin America and Bahamians by Female Unemployment
In terms of female unemployment, the demographic groups most similar to Immigrants from Latin America are Immigrants from El Salvador (6.1%, a difference of 0.10%), Mexican (6.1%, a difference of 0.20%), Immigrants from Trinidad and Tobago (6.1%, a difference of 0.28%), Immigrants from West Indies (6.1%, a difference of 0.34%), and Immigrants from Caribbean (6.1%, a difference of 0.45%). Similarly, the demographic groups most similar to Bahamians are Senegalese (6.0%, a difference of 0.040%), Immigrants from Ghana (6.0%, a difference of 0.40%), Yaqui (6.0%, a difference of 0.40%), Armenian (6.0%, a difference of 0.51%), and Mexican American Indian (6.0%, a difference of 0.57%).
| Demographics | Rating | Rank | Female Unemployment |
| Senegalese | 0.0 /100 | #275 | Tragic 6.0% |
| Bahamians | 0.0 /100 | #276 | Tragic 6.0% |
| Immigrants | Ghana | 0.0 /100 | #277 | Tragic 6.0% |
| Yaqui | 0.0 /100 | #278 | Tragic 6.0% |
| Armenians | 0.0 /100 | #279 | Tragic 6.0% |
| Mexican American Indians | 0.0 /100 | #280 | Tragic 6.0% |
| Guatemalans | 0.0 /100 | #281 | Tragic 6.0% |
| Colville | 0.0 /100 | #282 | Tragic 6.0% |
| Salvadorans | 0.0 /100 | #283 | Tragic 6.0% |
| Immigrants | Senegal | 0.0 /100 | #284 | Tragic 6.1% |
| Immigrants | Cabo Verde | 0.0 /100 | #285 | Tragic 6.1% |
| Chippewa | 0.0 /100 | #286 | Tragic 6.1% |
| Immigrants | Guatemala | 0.0 /100 | #287 | Tragic 6.1% |
| Haitians | 0.0 /100 | #288 | Tragic 6.1% |
| Trinidadians and Tobagonians | 0.0 /100 | #289 | Tragic 6.1% |
| Immigrants | Caribbean | 0.0 /100 | #290 | Tragic 6.1% |
| Immigrants | West Indies | 0.0 /100 | #291 | Tragic 6.1% |
| Immigrants | Trinidad and Tobago | 0.0 /100 | #292 | Tragic 6.1% |
| Mexicans | 0.0 /100 | #293 | Tragic 6.1% |
| Immigrants | El Salvador | 0.0 /100 | #294 | Tragic 6.1% |
| Immigrants | Latin America | 0.0 /100 | #295 | Tragic 6.1% |