Immigrants from Malaysia vs Bahamian Female Unemployment
COMPARE
Immigrants from Malaysia
Bahamian
Female Unemployment
Female Unemployment Comparison
Immigrants from Malaysia
Bahamians
5.0%
FEMALE UNEMPLOYMENT
95.7/ 100
METRIC RATING
94th/ 347
METRIC RANK
6.0%
FEMALE UNEMPLOYMENT
0.0/ 100
METRIC RATING
276th/ 347
METRIC RANK
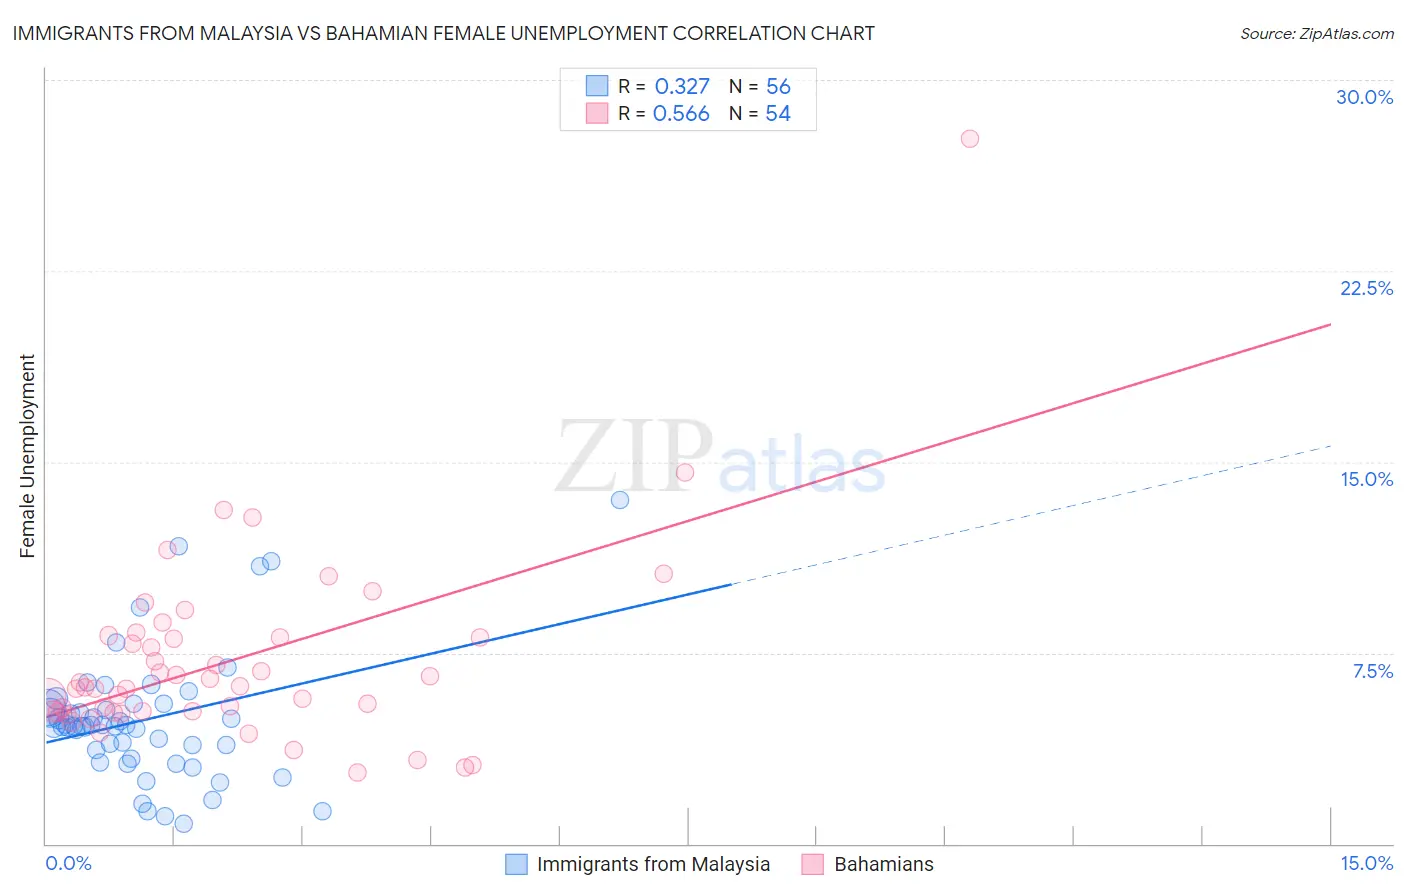
Immigrants from Malaysia vs Bahamian Female Unemployment Correlation Chart
The statistical analysis conducted on geographies consisting of 197,775,258 people shows a mild positive correlation between the proportion of Immigrants from Malaysia and unemploymnet rate among females in the United States with a correlation coefficient (R) of 0.327 and weighted average of 5.0%. Similarly, the statistical analysis conducted on geographies consisting of 112,545,227 people shows a substantial positive correlation between the proportion of Bahamians and unemploymnet rate among females in the United States with a correlation coefficient (R) of 0.566 and weighted average of 6.0%, a difference of 19.3%.
Female Unemployment Correlation Summary
| Measurement | Immigrants from Malaysia | Bahamian |
| Minimum | 0.80% | 2.8% |
| Maximum | 13.5% | 27.7% |
| Range | 12.7% | 24.9% |
| Mean | 4.9% | 7.2% |
| Median | 4.6% | 6.2% |
| Interquartile 25% (IQ1) | 3.5% | 5.2% |
| Interquartile 75% (IQ3) | 5.4% | 8.1% |
| Interquartile Range (IQR) | 1.9% | 2.9% |
| Standard Deviation (Sample) | 2.5% | 3.8% |
| Standard Deviation (Population) | 2.5% | 3.8% |
Similar Demographics by Female Unemployment
Demographics Similar to Immigrants from Malaysia by Female Unemployment
In terms of female unemployment, the demographic groups most similar to Immigrants from Malaysia are Immigrants from Austria (5.0%, a difference of 0.020%), Burmese (5.0%, a difference of 0.020%), Immigrants from South Central Asia (5.0%, a difference of 0.060%), Romanian (5.0%, a difference of 0.10%), and Immigrants from Japan (5.0%, a difference of 0.13%).
| Demographics | Rating | Rank | Female Unemployment |
| Venezuelans | 96.9 /100 | #87 | Exceptional 5.0% |
| Immigrants | Sudan | 96.7 /100 | #88 | Exceptional 5.0% |
| Immigrants | Taiwan | 96.6 /100 | #89 | Exceptional 5.0% |
| Immigrants | Sweden | 96.3 /100 | #90 | Exceptional 5.0% |
| Immigrants | Japan | 96.0 /100 | #91 | Exceptional 5.0% |
| Romanians | 95.9 /100 | #92 | Exceptional 5.0% |
| Immigrants | Austria | 95.7 /100 | #93 | Exceptional 5.0% |
| Immigrants | Malaysia | 95.7 /100 | #94 | Exceptional 5.0% |
| Burmese | 95.6 /100 | #95 | Exceptional 5.0% |
| Immigrants | South Central Asia | 95.5 /100 | #96 | Exceptional 5.0% |
| Immigrants | Somalia | 95.2 /100 | #97 | Exceptional 5.0% |
| Immigrants | Kuwait | 95.2 /100 | #98 | Exceptional 5.0% |
| Immigrants | Zaire | 95.2 /100 | #99 | Exceptional 5.0% |
| Indonesians | 95.1 /100 | #100 | Exceptional 5.0% |
| Immigrants | Czechoslovakia | 95.0 /100 | #101 | Exceptional 5.0% |
Demographics Similar to Bahamians by Female Unemployment
In terms of female unemployment, the demographic groups most similar to Bahamians are Senegalese (6.0%, a difference of 0.040%), Immigrants from Ghana (6.0%, a difference of 0.40%), Yaqui (6.0%, a difference of 0.40%), Armenian (6.0%, a difference of 0.51%), and African (5.9%, a difference of 0.53%).
| Demographics | Rating | Rank | Female Unemployment |
| Immigrants | Western Africa | 0.0 /100 | #269 | Tragic 5.9% |
| Immigrants | Honduras | 0.0 /100 | #270 | Tragic 5.9% |
| Central Americans | 0.0 /100 | #271 | Tragic 5.9% |
| Lumbee | 0.0 /100 | #272 | Tragic 5.9% |
| Ghanaians | 0.0 /100 | #273 | Tragic 5.9% |
| Africans | 0.0 /100 | #274 | Tragic 5.9% |
| Senegalese | 0.0 /100 | #275 | Tragic 6.0% |
| Bahamians | 0.0 /100 | #276 | Tragic 6.0% |
| Immigrants | Ghana | 0.0 /100 | #277 | Tragic 6.0% |
| Yaqui | 0.0 /100 | #278 | Tragic 6.0% |
| Armenians | 0.0 /100 | #279 | Tragic 6.0% |
| Mexican American Indians | 0.0 /100 | #280 | Tragic 6.0% |
| Guatemalans | 0.0 /100 | #281 | Tragic 6.0% |
| Colville | 0.0 /100 | #282 | Tragic 6.0% |
| Salvadorans | 0.0 /100 | #283 | Tragic 6.0% |