Bolivian vs Native/Alaskan Master's Degree
COMPARE
Bolivian
Native/Alaskan
Master's Degree
Master's Degree Comparison
Bolivians
Natives/Alaskans
19.3%
MASTER'S DEGREE
100.0/ 100
METRIC RATING
38th/ 347
METRIC RANK
9.9%
MASTER'S DEGREE
0.0/ 100
METRIC RATING
336th/ 347
METRIC RANK
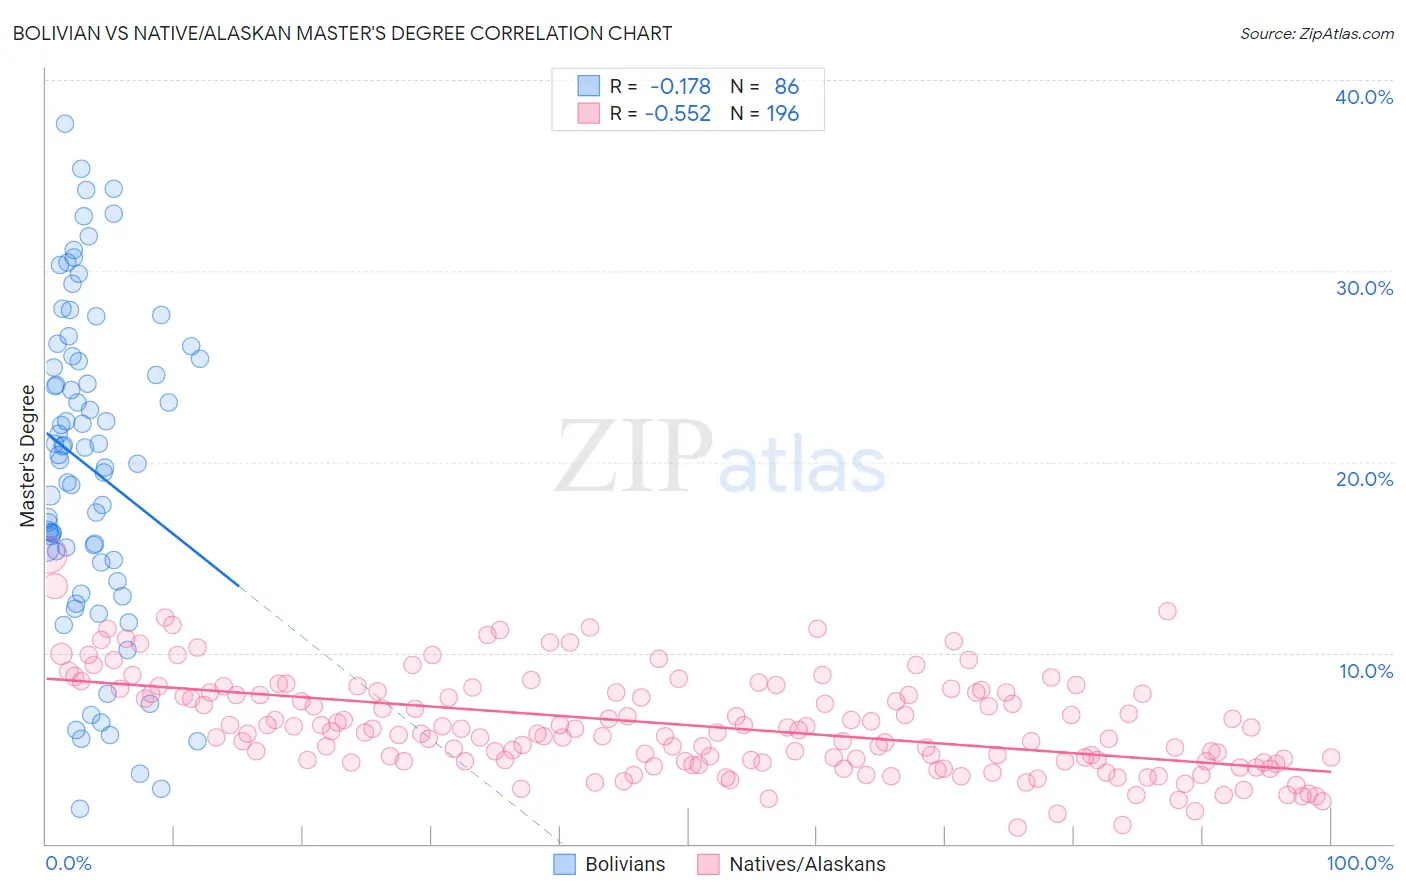
Bolivian vs Native/Alaskan Master's Degree Correlation Chart
The statistical analysis conducted on geographies consisting of 184,652,139 people shows a poor negative correlation between the proportion of Bolivians and percentage of population with at least master's degree education in the United States with a correlation coefficient (R) of -0.178 and weighted average of 19.3%. Similarly, the statistical analysis conducted on geographies consisting of 512,468,242 people shows a substantial negative correlation between the proportion of Natives/Alaskans and percentage of population with at least master's degree education in the United States with a correlation coefficient (R) of -0.552 and weighted average of 9.9%, a difference of 94.0%.
Master's Degree Correlation Summary
| Measurement | Bolivian | Native/Alaskan |
| Minimum | 1.8% | 0.88% |
| Maximum | 37.7% | 15.1% |
| Range | 35.9% | 14.3% |
| Mean | 19.7% | 6.2% |
| Median | 20.2% | 5.9% |
| Interquartile 25% (IQ1) | 14.9% | 4.3% |
| Interquartile 75% (IQ3) | 25.4% | 7.9% |
| Interquartile Range (IQR) | 10.5% | 3.6% |
| Standard Deviation (Sample) | 8.3% | 2.6% |
| Standard Deviation (Population) | 8.3% | 2.6% |
Similar Demographics by Master's Degree
Demographics Similar to Bolivians by Master's Degree
In terms of master's degree, the demographic groups most similar to Bolivians are Immigrants from Spain (19.1%, a difference of 0.64%), Mongolian (19.4%, a difference of 0.69%), Immigrants from Russia (19.4%, a difference of 0.73%), Immigrants from Bolivia (19.1%, a difference of 0.77%), and Immigrants from Northern Europe (19.5%, a difference of 1.1%).
| Demographics | Rating | Rank | Master's Degree |
| Immigrants | Korea | 100.0 /100 | #31 | Exceptional 19.7% |
| Burmese | 100.0 /100 | #32 | Exceptional 19.7% |
| Russians | 100.0 /100 | #33 | Exceptional 19.5% |
| Immigrants | Denmark | 100.0 /100 | #34 | Exceptional 19.5% |
| Immigrants | Northern Europe | 100.0 /100 | #35 | Exceptional 19.5% |
| Immigrants | Russia | 100.0 /100 | #36 | Exceptional 19.4% |
| Mongolians | 100.0 /100 | #37 | Exceptional 19.4% |
| Bolivians | 100.0 /100 | #38 | Exceptional 19.3% |
| Immigrants | Spain | 100.0 /100 | #39 | Exceptional 19.1% |
| Immigrants | Bolivia | 100.0 /100 | #40 | Exceptional 19.1% |
| Immigrants | Latvia | 100.0 /100 | #41 | Exceptional 19.1% |
| Immigrants | Saudi Arabia | 100.0 /100 | #42 | Exceptional 19.0% |
| Immigrants | Greece | 100.0 /100 | #43 | Exceptional 19.0% |
| Immigrants | Malaysia | 100.0 /100 | #44 | Exceptional 18.9% |
| Immigrants | Belarus | 100.0 /100 | #45 | Exceptional 18.9% |
Demographics Similar to Natives/Alaskans by Master's Degree
In terms of master's degree, the demographic groups most similar to Natives/Alaskans are Immigrants from Central America (10.0%, a difference of 0.50%), Arapaho (10.0%, a difference of 0.64%), Mexican (9.7%, a difference of 2.2%), Tohono O'odham (9.7%, a difference of 2.3%), and Menominee (10.2%, a difference of 2.6%).
| Demographics | Rating | Rank | Master's Degree |
| Nepalese | 0.0 /100 | #329 | Tragic 10.5% |
| Fijians | 0.0 /100 | #330 | Tragic 10.3% |
| Pueblo | 0.0 /100 | #331 | Tragic 10.3% |
| Immigrants | Azores | 0.0 /100 | #332 | Tragic 10.2% |
| Menominee | 0.0 /100 | #333 | Tragic 10.2% |
| Arapaho | 0.0 /100 | #334 | Tragic 10.0% |
| Immigrants | Central America | 0.0 /100 | #335 | Tragic 10.0% |
| Natives/Alaskans | 0.0 /100 | #336 | Tragic 9.9% |
| Mexicans | 0.0 /100 | #337 | Tragic 9.7% |
| Tohono O'odham | 0.0 /100 | #338 | Tragic 9.7% |
| Spanish American Indians | 0.0 /100 | #339 | Tragic 9.6% |
| Yakama | 0.0 /100 | #340 | Tragic 9.5% |
| Navajo | 0.0 /100 | #341 | Tragic 9.4% |
| Immigrants | Mexico | 0.0 /100 | #342 | Tragic 9.3% |
| Lumbee | 0.0 /100 | #343 | Tragic 9.3% |