Bolivian vs Salvadoran Male Unemployment
COMPARE
Bolivian
Salvadoran
Male Unemployment
Male Unemployment Comparison
Bolivians
Salvadorans
4.7%
MALE UNEMPLOYMENT
100.0/ 100
METRIC RATING
13th/ 347
METRIC RANK
5.7%
MALE UNEMPLOYMENT
1.0/ 100
METRIC RATING
241st/ 347
METRIC RANK
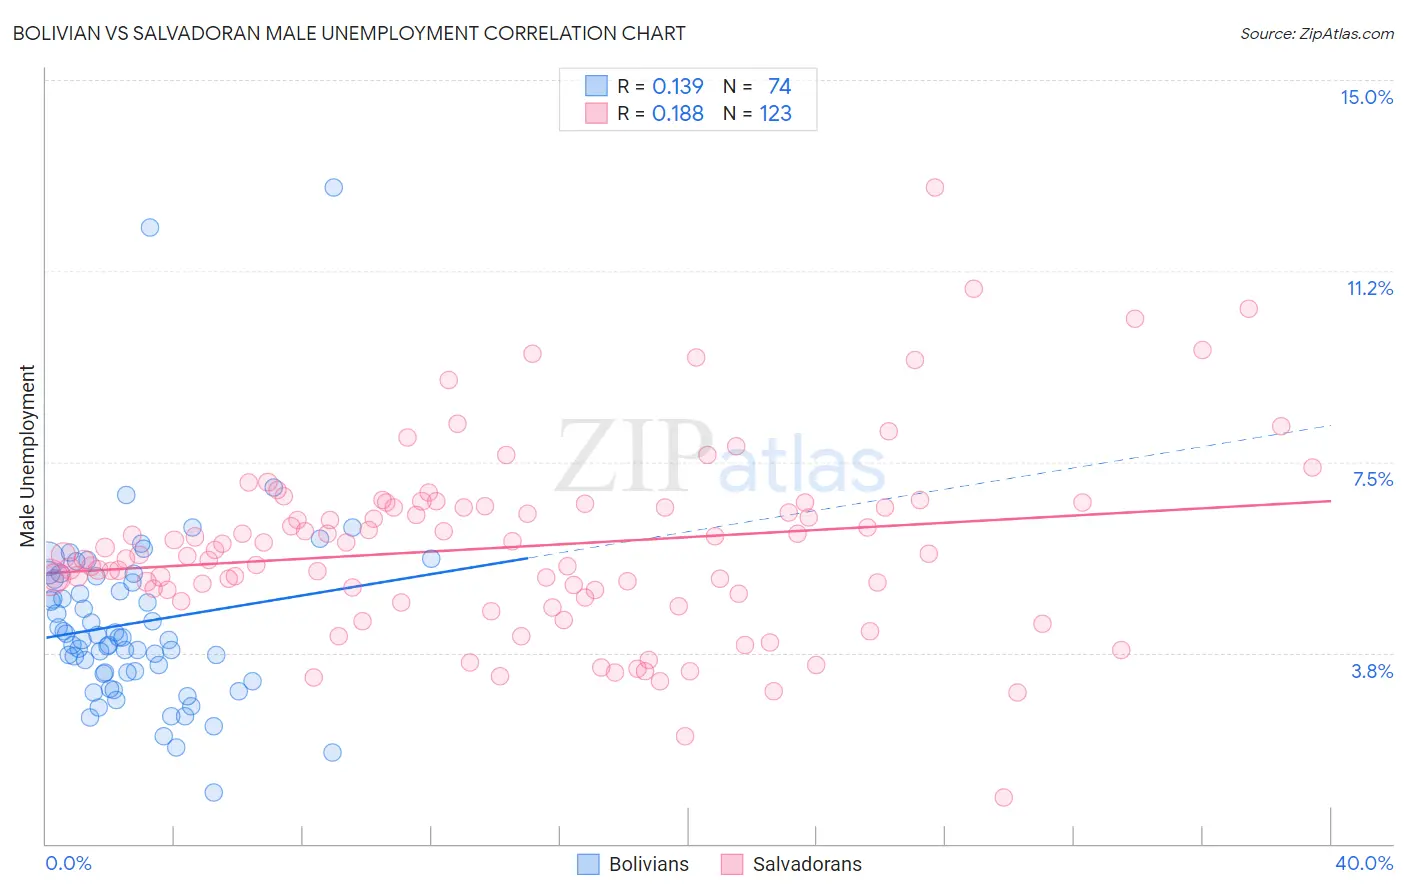
Bolivian vs Salvadoran Male Unemployment Correlation Chart
The statistical analysis conducted on geographies consisting of 184,402,671 people shows a poor positive correlation between the proportion of Bolivians and unemployment rate among males in the United States with a correlation coefficient (R) of 0.139 and weighted average of 4.7%. Similarly, the statistical analysis conducted on geographies consisting of 397,423,657 people shows a poor positive correlation between the proportion of Salvadorans and unemployment rate among males in the United States with a correlation coefficient (R) of 0.188 and weighted average of 5.7%, a difference of 20.4%.
Male Unemployment Correlation Summary
| Measurement | Bolivian | Salvadoran |
| Minimum | 1.0% | 0.90% |
| Maximum | 12.9% | 12.9% |
| Range | 11.9% | 12.0% |
| Mean | 4.3% | 5.8% |
| Median | 4.0% | 5.7% |
| Interquartile 25% (IQ1) | 3.4% | 4.9% |
| Interquartile 75% (IQ3) | 5.2% | 6.6% |
| Interquartile Range (IQR) | 1.8% | 1.7% |
| Standard Deviation (Sample) | 1.8% | 1.8% |
| Standard Deviation (Population) | 1.8% | 1.8% |
Similar Demographics by Male Unemployment
Demographics Similar to Bolivians by Male Unemployment
In terms of male unemployment, the demographic groups most similar to Bolivians are German (4.7%, a difference of 0.020%), Scandinavian (4.7%, a difference of 0.29%), Swiss (4.7%, a difference of 0.34%), Immigrants from Bolivia (4.7%, a difference of 0.68%), and Filipino (4.7%, a difference of 1.1%).
| Demographics | Rating | Rank | Male Unemployment |
| Venezuelans | 100.0 /100 | #6 | Exceptional 4.5% |
| Czechs | 100.0 /100 | #7 | Exceptional 4.5% |
| Luxembourgers | 100.0 /100 | #8 | Exceptional 4.5% |
| Thais | 100.0 /100 | #9 | Exceptional 4.6% |
| Cubans | 100.0 /100 | #10 | Exceptional 4.6% |
| Swedes | 100.0 /100 | #11 | Exceptional 4.6% |
| Immigrants | Bolivia | 100.0 /100 | #12 | Exceptional 4.7% |
| Bolivians | 100.0 /100 | #13 | Exceptional 4.7% |
| Germans | 100.0 /100 | #14 | Exceptional 4.7% |
| Scandinavians | 100.0 /100 | #15 | Exceptional 4.7% |
| Swiss | 99.9 /100 | #16 | Exceptional 4.7% |
| Filipinos | 99.9 /100 | #17 | Exceptional 4.7% |
| English | 99.9 /100 | #18 | Exceptional 4.8% |
| Europeans | 99.9 /100 | #19 | Exceptional 4.8% |
| Pennsylvania Germans | 99.9 /100 | #20 | Exceptional 4.8% |
Demographics Similar to Salvadorans by Male Unemployment
In terms of male unemployment, the demographic groups most similar to Salvadorans are Immigrants from Cameroon (5.6%, a difference of 0.040%), Ottawa (5.7%, a difference of 0.070%), Immigrants from Guatemala (5.6%, a difference of 0.11%), Native Hawaiian (5.6%, a difference of 0.12%), and Honduran (5.6%, a difference of 0.16%).
| Demographics | Rating | Rank | Male Unemployment |
| Immigrants | Somalia | 1.5 /100 | #234 | Tragic 5.6% |
| Immigrants | Honduras | 1.5 /100 | #235 | Tragic 5.6% |
| Guatemalans | 1.2 /100 | #236 | Tragic 5.6% |
| Hondurans | 1.1 /100 | #237 | Tragic 5.6% |
| Native Hawaiians | 1.1 /100 | #238 | Tragic 5.6% |
| Immigrants | Guatemala | 1.1 /100 | #239 | Tragic 5.6% |
| Immigrants | Cameroon | 1.0 /100 | #240 | Tragic 5.6% |
| Salvadorans | 1.0 /100 | #241 | Tragic 5.7% |
| Ottawa | 0.9 /100 | #242 | Tragic 5.7% |
| Bangladeshis | 0.8 /100 | #243 | Tragic 5.7% |
| Immigrants | El Salvador | 0.7 /100 | #244 | Tragic 5.7% |
| Yaqui | 0.7 /100 | #245 | Tragic 5.7% |
| Iroquois | 0.6 /100 | #246 | Tragic 5.7% |
| Hawaiians | 0.6 /100 | #247 | Tragic 5.7% |
| Marshallese | 0.5 /100 | #248 | Tragic 5.7% |