Bolivian vs Immigrants from South America Male Unemployment
COMPARE
Bolivian
Immigrants from South America
Male Unemployment
Male Unemployment Comparison
Bolivians
Immigrants from South America
4.7%
MALE UNEMPLOYMENT
100.0/ 100
METRIC RATING
13th/ 347
METRIC RANK
5.4%
MALE UNEMPLOYMENT
29.4/ 100
METRIC RATING
189th/ 347
METRIC RANK
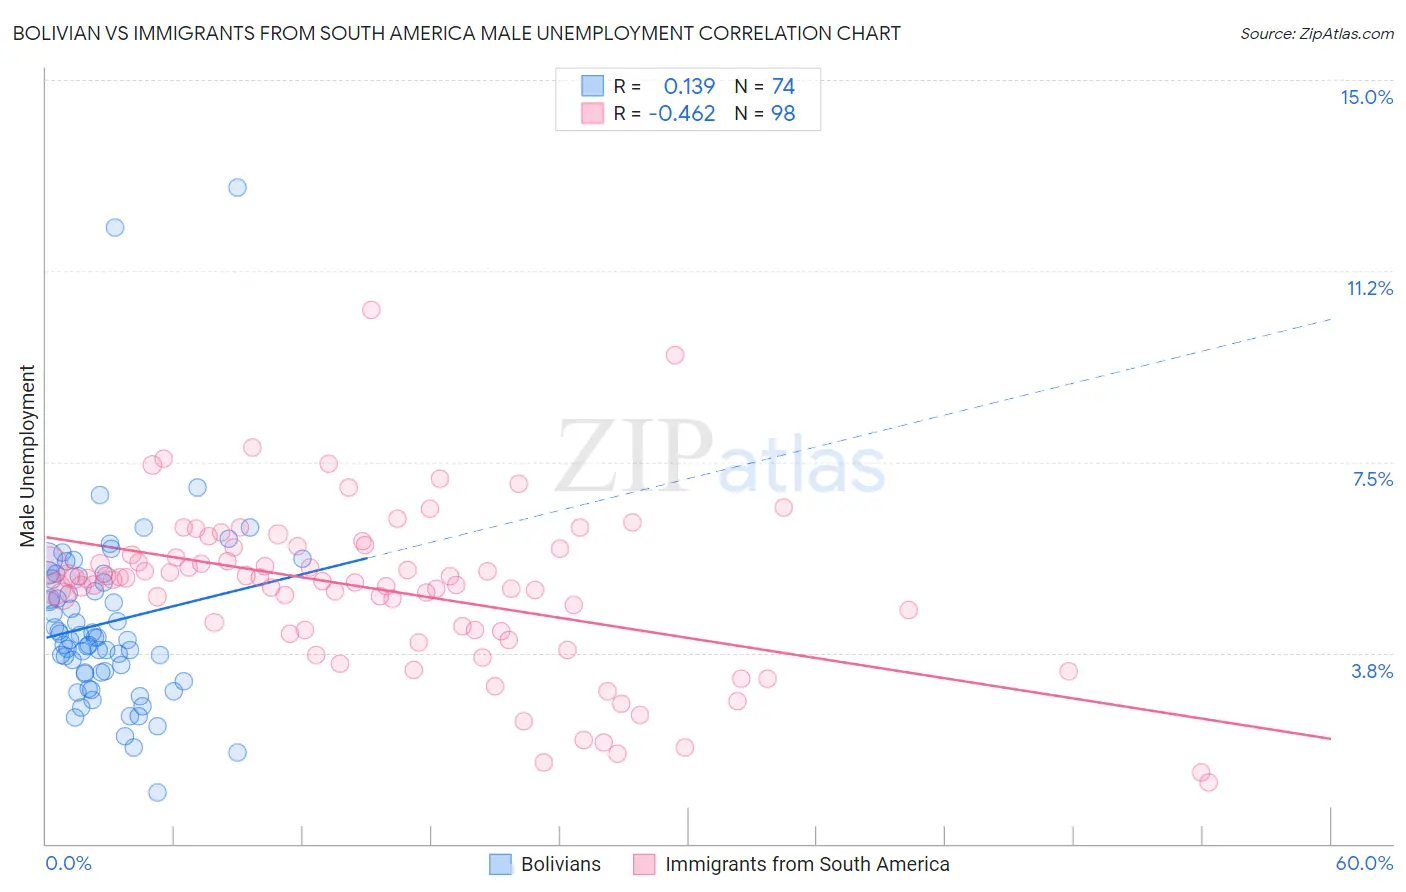
Bolivian vs Immigrants from South America Male Unemployment Correlation Chart
The statistical analysis conducted on geographies consisting of 184,402,671 people shows a poor positive correlation between the proportion of Bolivians and unemployment rate among males in the United States with a correlation coefficient (R) of 0.139 and weighted average of 4.7%. Similarly, the statistical analysis conducted on geographies consisting of 483,078,598 people shows a moderate negative correlation between the proportion of Immigrants from South America and unemployment rate among males in the United States with a correlation coefficient (R) of -0.462 and weighted average of 5.4%, a difference of 14.3%.
Male Unemployment Correlation Summary
| Measurement | Bolivian | Immigrants from South America |
| Minimum | 1.0% | 1.2% |
| Maximum | 12.9% | 10.5% |
| Range | 11.9% | 9.3% |
| Mean | 4.3% | 5.0% |
| Median | 4.0% | 5.2% |
| Interquartile 25% (IQ1) | 3.4% | 4.2% |
| Interquartile 75% (IQ3) | 5.2% | 5.8% |
| Interquartile Range (IQR) | 1.8% | 1.6% |
| Standard Deviation (Sample) | 1.8% | 1.6% |
| Standard Deviation (Population) | 1.8% | 1.6% |
Similar Demographics by Male Unemployment
Demographics Similar to Bolivians by Male Unemployment
In terms of male unemployment, the demographic groups most similar to Bolivians are German (4.7%, a difference of 0.020%), Scandinavian (4.7%, a difference of 0.29%), Swiss (4.7%, a difference of 0.34%), Immigrants from Bolivia (4.7%, a difference of 0.68%), and Filipino (4.7%, a difference of 1.1%).
| Demographics | Rating | Rank | Male Unemployment |
| Venezuelans | 100.0 /100 | #6 | Exceptional 4.5% |
| Czechs | 100.0 /100 | #7 | Exceptional 4.5% |
| Luxembourgers | 100.0 /100 | #8 | Exceptional 4.5% |
| Thais | 100.0 /100 | #9 | Exceptional 4.6% |
| Cubans | 100.0 /100 | #10 | Exceptional 4.6% |
| Swedes | 100.0 /100 | #11 | Exceptional 4.6% |
| Immigrants | Bolivia | 100.0 /100 | #12 | Exceptional 4.7% |
| Bolivians | 100.0 /100 | #13 | Exceptional 4.7% |
| Germans | 100.0 /100 | #14 | Exceptional 4.7% |
| Scandinavians | 100.0 /100 | #15 | Exceptional 4.7% |
| Swiss | 99.9 /100 | #16 | Exceptional 4.7% |
| Filipinos | 99.9 /100 | #17 | Exceptional 4.7% |
| English | 99.9 /100 | #18 | Exceptional 4.8% |
| Europeans | 99.9 /100 | #19 | Exceptional 4.8% |
| Pennsylvania Germans | 99.9 /100 | #20 | Exceptional 4.8% |
Demographics Similar to Immigrants from South America by Male Unemployment
In terms of male unemployment, the demographic groups most similar to Immigrants from South America are Immigrants from Uganda (5.4%, a difference of 0.040%), Arab (5.4%, a difference of 0.060%), Immigrants from South Eastern Asia (5.4%, a difference of 0.080%), Costa Rican (5.4%, a difference of 0.13%), and Iraqi (5.4%, a difference of 0.15%).
| Demographics | Rating | Rank | Male Unemployment |
| Potawatomi | 37.8 /100 | #182 | Fair 5.3% |
| Taiwanese | 37.6 /100 | #183 | Fair 5.3% |
| Spaniards | 35.1 /100 | #184 | Fair 5.3% |
| Koreans | 34.9 /100 | #185 | Fair 5.3% |
| Iraqis | 31.6 /100 | #186 | Fair 5.4% |
| Costa Ricans | 31.3 /100 | #187 | Fair 5.4% |
| Arabs | 30.2 /100 | #188 | Fair 5.4% |
| Immigrants | South America | 29.4 /100 | #189 | Fair 5.4% |
| Immigrants | Uganda | 28.8 /100 | #190 | Fair 5.4% |
| Immigrants | South Eastern Asia | 28.2 /100 | #191 | Fair 5.4% |
| Immigrants | Belarus | 26.0 /100 | #192 | Fair 5.4% |
| Immigrants | Israel | 25.2 /100 | #193 | Fair 5.4% |
| Spanish | 19.7 /100 | #194 | Poor 5.4% |
| Immigrants | Southern Europe | 17.7 /100 | #195 | Poor 5.4% |
| Albanians | 17.3 /100 | #196 | Poor 5.4% |