Black/African American vs White/Caucasian Unemployment Among Ages 20 to 24 years
COMPARE
Black/African American
White/Caucasian
Unemployment Among Ages 20 to 24 years
Unemployment Among Ages 20 to 24 years Comparison
Blacks/African Americans
Whites/Caucasians
12.7%
UNEMPLOYMENT AMONG AGES 20 TO 24 YEARS
0.0/ 100
METRIC RATING
314th/ 347
METRIC RANK
10.1%
UNEMPLOYMENT AMONG AGES 20 TO 24 YEARS
87.4/ 100
METRIC RATING
122nd/ 347
METRIC RANK
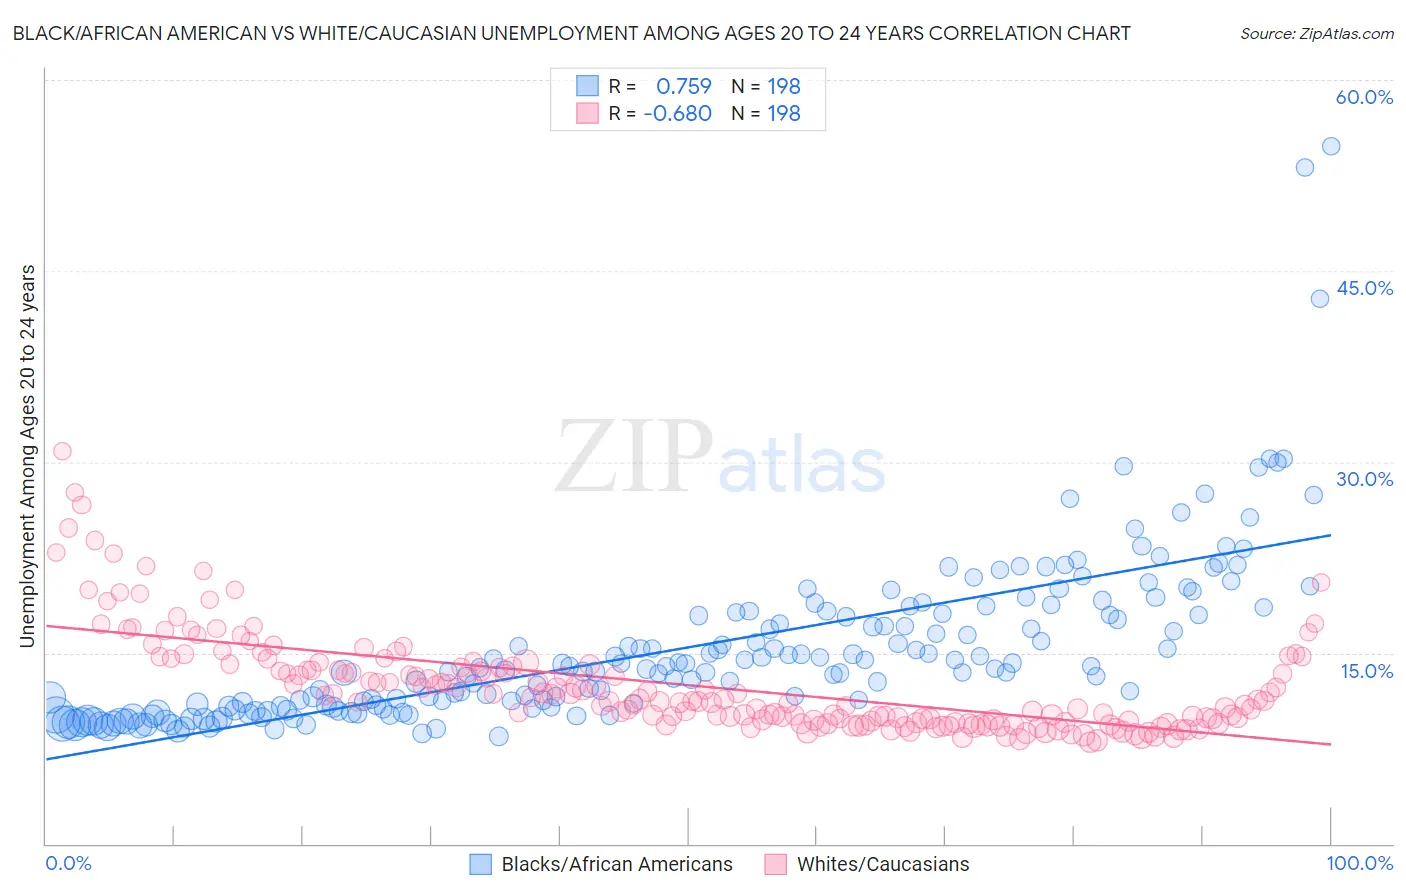
Black/African American vs White/Caucasian Unemployment Among Ages 20 to 24 years Correlation Chart
The statistical analysis conducted on geographies consisting of 523,414,021 people shows a strong positive correlation between the proportion of Blacks/African Americans and unemployment rate among population between the ages 20 and 24 in the United States with a correlation coefficient (R) of 0.759 and weighted average of 12.7%. Similarly, the statistical analysis conducted on geographies consisting of 530,440,022 people shows a significant negative correlation between the proportion of Whites/Caucasians and unemployment rate among population between the ages 20 and 24 in the United States with a correlation coefficient (R) of -0.680 and weighted average of 10.1%, a difference of 25.8%.
Unemployment Among Ages 20 to 24 years Correlation Summary
| Measurement | Black/African American | White/Caucasian |
| Minimum | 8.4% | 8.0% |
| Maximum | 54.7% | 30.8% |
| Range | 46.3% | 22.8% |
| Mean | 15.4% | 12.5% |
| Median | 13.7% | 11.3% |
| Interquartile 25% (IQ1) | 10.7% | 9.6% |
| Interquartile 75% (IQ3) | 18.1% | 13.9% |
| Interquartile Range (IQR) | 7.4% | 4.3% |
| Standard Deviation (Sample) | 6.7% | 3.9% |
| Standard Deviation (Population) | 6.6% | 3.9% |
Similar Demographics by Unemployment Among Ages 20 to 24 years
Demographics Similar to Blacks/African Americans by Unemployment Among Ages 20 to 24 years
In terms of unemployment among ages 20 to 24 years, the demographic groups most similar to Blacks/African Americans are Shoshone (12.7%, a difference of 0.19%), West Indian (12.8%, a difference of 0.21%), Immigrants from Dominica (12.8%, a difference of 0.68%), Houma (12.6%, a difference of 0.73%), and Immigrants from Trinidad and Tobago (12.8%, a difference of 0.80%).
| Demographics | Rating | Rank | Unemployment Among Ages 20 to 24 years |
| Bermudans | 0.0 /100 | #307 | Tragic 12.5% |
| Tohono O'odham | 0.0 /100 | #308 | Tragic 12.5% |
| Immigrants | Bangladesh | 0.0 /100 | #309 | Tragic 12.6% |
| Jamaicans | 0.0 /100 | #310 | Tragic 12.6% |
| Vietnamese | 0.0 /100 | #311 | Tragic 12.6% |
| Houma | 0.0 /100 | #312 | Tragic 12.6% |
| Shoshone | 0.0 /100 | #313 | Tragic 12.7% |
| Blacks/African Americans | 0.0 /100 | #314 | Tragic 12.7% |
| West Indians | 0.0 /100 | #315 | Tragic 12.8% |
| Immigrants | Dominica | 0.0 /100 | #316 | Tragic 12.8% |
| Immigrants | Trinidad and Tobago | 0.0 /100 | #317 | Tragic 12.8% |
| Barbadians | 0.0 /100 | #318 | Tragic 12.9% |
| Trinidadians and Tobagonians | 0.0 /100 | #319 | Tragic 12.9% |
| Cheyenne | 0.0 /100 | #320 | Tragic 13.0% |
| Immigrants | Jamaica | 0.0 /100 | #321 | Tragic 13.0% |
Demographics Similar to Whites/Caucasians by Unemployment Among Ages 20 to 24 years
In terms of unemployment among ages 20 to 24 years, the demographic groups most similar to Whites/Caucasians are Immigrants from Iraq (10.1%, a difference of 0.020%), South African (10.1%, a difference of 0.040%), Immigrants from Canada (10.1%, a difference of 0.070%), Immigrants from Japan (10.1%, a difference of 0.070%), and French (10.1%, a difference of 0.080%).
| Demographics | Rating | Rank | Unemployment Among Ages 20 to 24 years |
| Immigrants | Morocco | 90.5 /100 | #115 | Exceptional 10.1% |
| Basques | 89.8 /100 | #116 | Excellent 10.1% |
| Immigrants | Uruguay | 89.6 /100 | #117 | Excellent 10.1% |
| Paraguayans | 88.6 /100 | #118 | Excellent 10.1% |
| French | 88.2 /100 | #119 | Excellent 10.1% |
| Immigrants | Canada | 88.2 /100 | #120 | Excellent 10.1% |
| South Africans | 87.8 /100 | #121 | Excellent 10.1% |
| Whites/Caucasians | 87.4 /100 | #122 | Excellent 10.1% |
| Immigrants | Iraq | 87.1 /100 | #123 | Excellent 10.1% |
| Immigrants | Japan | 86.5 /100 | #124 | Excellent 10.1% |
| Spanish | 86.1 /100 | #125 | Excellent 10.1% |
| Jordanians | 86.1 /100 | #126 | Excellent 10.1% |
| Immigrants | Norway | 85.3 /100 | #127 | Excellent 10.1% |
| Immigrants | Brazil | 84.9 /100 | #128 | Excellent 10.1% |
| Immigrants | South Central Asia | 84.6 /100 | #129 | Excellent 10.1% |