Black/African American vs White/Caucasian Unemployment Among Ages 60 to 64 years
COMPARE
Black/African American
White/Caucasian
Unemployment Among Ages 60 to 64 years
Unemployment Among Ages 60 to 64 years Comparison
Blacks/African Americans
Whites/Caucasians
5.3%
UNEMPLOYMENT AMONG AGES 60 TO 64 YEARS
0.0/ 100
METRIC RATING
294th/ 347
METRIC RANK
4.7%
UNEMPLOYMENT AMONG AGES 60 TO 64 YEARS
97.8/ 100
METRIC RATING
103rd/ 347
METRIC RANK
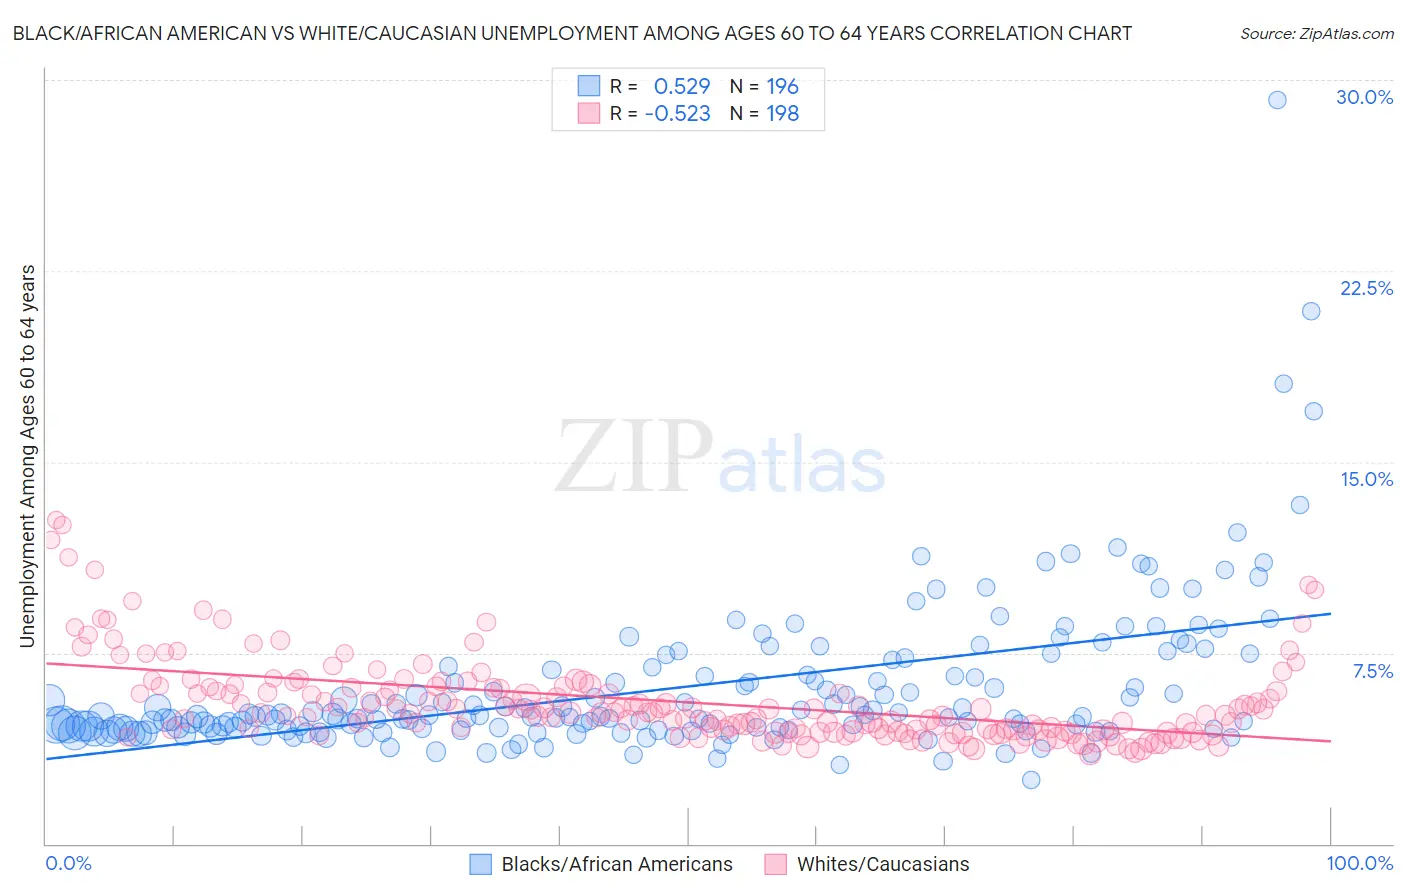
Black/African American vs White/Caucasian Unemployment Among Ages 60 to 64 years Correlation Chart
The statistical analysis conducted on geographies consisting of 465,577,423 people shows a substantial positive correlation between the proportion of Blacks/African Americans and unemployment rate among population between the ages 60 and 64 in the United States with a correlation coefficient (R) of 0.529 and weighted average of 5.3%. Similarly, the statistical analysis conducted on geographies consisting of 469,979,801 people shows a substantial negative correlation between the proportion of Whites/Caucasians and unemployment rate among population between the ages 60 and 64 in the United States with a correlation coefficient (R) of -0.523 and weighted average of 4.7%, a difference of 13.3%.
Unemployment Among Ages 60 to 64 years Correlation Summary
| Measurement | Black/African American | White/Caucasian |
| Minimum | 2.5% | 3.5% |
| Maximum | 29.2% | 12.7% |
| Range | 26.7% | 9.2% |
| Mean | 6.1% | 5.6% |
| Median | 5.0% | 5.1% |
| Interquartile 25% (IQ1) | 4.5% | 4.4% |
| Interquartile 75% (IQ3) | 6.7% | 6.1% |
| Interquartile Range (IQR) | 2.2% | 1.7% |
| Standard Deviation (Sample) | 3.1% | 1.7% |
| Standard Deviation (Population) | 3.1% | 1.7% |
Similar Demographics by Unemployment Among Ages 60 to 64 years
Demographics Similar to Blacks/African Americans by Unemployment Among Ages 60 to 64 years
In terms of unemployment among ages 60 to 64 years, the demographic groups most similar to Blacks/African Americans are Armenian (5.3%, a difference of 0.030%), Immigrants from Israel (5.3%, a difference of 0.11%), Immigrants from Latin America (5.3%, a difference of 0.13%), Hispanic or Latino (5.3%, a difference of 0.15%), and Jamaican (5.3%, a difference of 0.15%).
| Demographics | Rating | Rank | Unemployment Among Ages 60 to 64 years |
| Salvadorans | 0.0 /100 | #287 | Tragic 5.3% |
| Trinidadians and Tobagonians | 0.0 /100 | #288 | Tragic 5.3% |
| Spanish Americans | 0.0 /100 | #289 | Tragic 5.3% |
| Immigrants | Trinidad and Tobago | 0.0 /100 | #290 | Tragic 5.3% |
| Hispanics or Latinos | 0.0 /100 | #291 | Tragic 5.3% |
| Immigrants | Latin America | 0.0 /100 | #292 | Tragic 5.3% |
| Immigrants | Israel | 0.0 /100 | #293 | Tragic 5.3% |
| Blacks/African Americans | 0.0 /100 | #294 | Tragic 5.3% |
| Armenians | 0.0 /100 | #295 | Tragic 5.3% |
| Jamaicans | 0.0 /100 | #296 | Tragic 5.3% |
| Osage | 0.0 /100 | #297 | Tragic 5.4% |
| Immigrants | Central America | 0.0 /100 | #298 | Tragic 5.4% |
| Immigrants | El Salvador | 0.0 /100 | #299 | Tragic 5.4% |
| Immigrants | Barbados | 0.0 /100 | #300 | Tragic 5.4% |
| Immigrants | Jamaica | 0.0 /100 | #301 | Tragic 5.4% |
Demographics Similar to Whites/Caucasians by Unemployment Among Ages 60 to 64 years
In terms of unemployment among ages 60 to 64 years, the demographic groups most similar to Whites/Caucasians are Immigrants from Canada (4.7%, a difference of 0.010%), Malaysian (4.7%, a difference of 0.020%), Portuguese (4.7%, a difference of 0.030%), Paraguayan (4.7%, a difference of 0.040%), and Egyptian (4.7%, a difference of 0.060%).
| Demographics | Rating | Rank | Unemployment Among Ages 60 to 64 years |
| Poles | 98.1 /100 | #96 | Exceptional 4.7% |
| Immigrants | Albania | 98.0 /100 | #97 | Exceptional 4.7% |
| Somalis | 98.0 /100 | #98 | Exceptional 4.7% |
| Egyptians | 98.0 /100 | #99 | Exceptional 4.7% |
| Portuguese | 97.9 /100 | #100 | Exceptional 4.7% |
| Malaysians | 97.9 /100 | #101 | Exceptional 4.7% |
| Immigrants | Canada | 97.8 /100 | #102 | Exceptional 4.7% |
| Whites/Caucasians | 97.8 /100 | #103 | Exceptional 4.7% |
| Paraguayans | 97.7 /100 | #104 | Exceptional 4.7% |
| Canadians | 97.7 /100 | #105 | Exceptional 4.7% |
| Immigrants | North America | 97.6 /100 | #106 | Exceptional 4.7% |
| Greeks | 97.5 /100 | #107 | Exceptional 4.7% |
| Immigrants | Japan | 97.4 /100 | #108 | Exceptional 4.7% |
| Immigrants | Netherlands | 97.4 /100 | #109 | Exceptional 4.7% |
| Ethiopians | 97.2 /100 | #110 | Exceptional 4.7% |