Alsatian vs White/Caucasian Unemployment Among Ages 20 to 24 years
COMPARE
Alsatian
White/Caucasian
Unemployment Among Ages 20 to 24 years
Unemployment Among Ages 20 to 24 years Comparison
Alsatians
Whites/Caucasians
10.3%
UNEMPLOYMENT AMONG AGES 20 TO 24 YEARS
40.5/ 100
METRIC RATING
178th/ 347
METRIC RANK
10.1%
UNEMPLOYMENT AMONG AGES 20 TO 24 YEARS
87.4/ 100
METRIC RATING
122nd/ 347
METRIC RANK
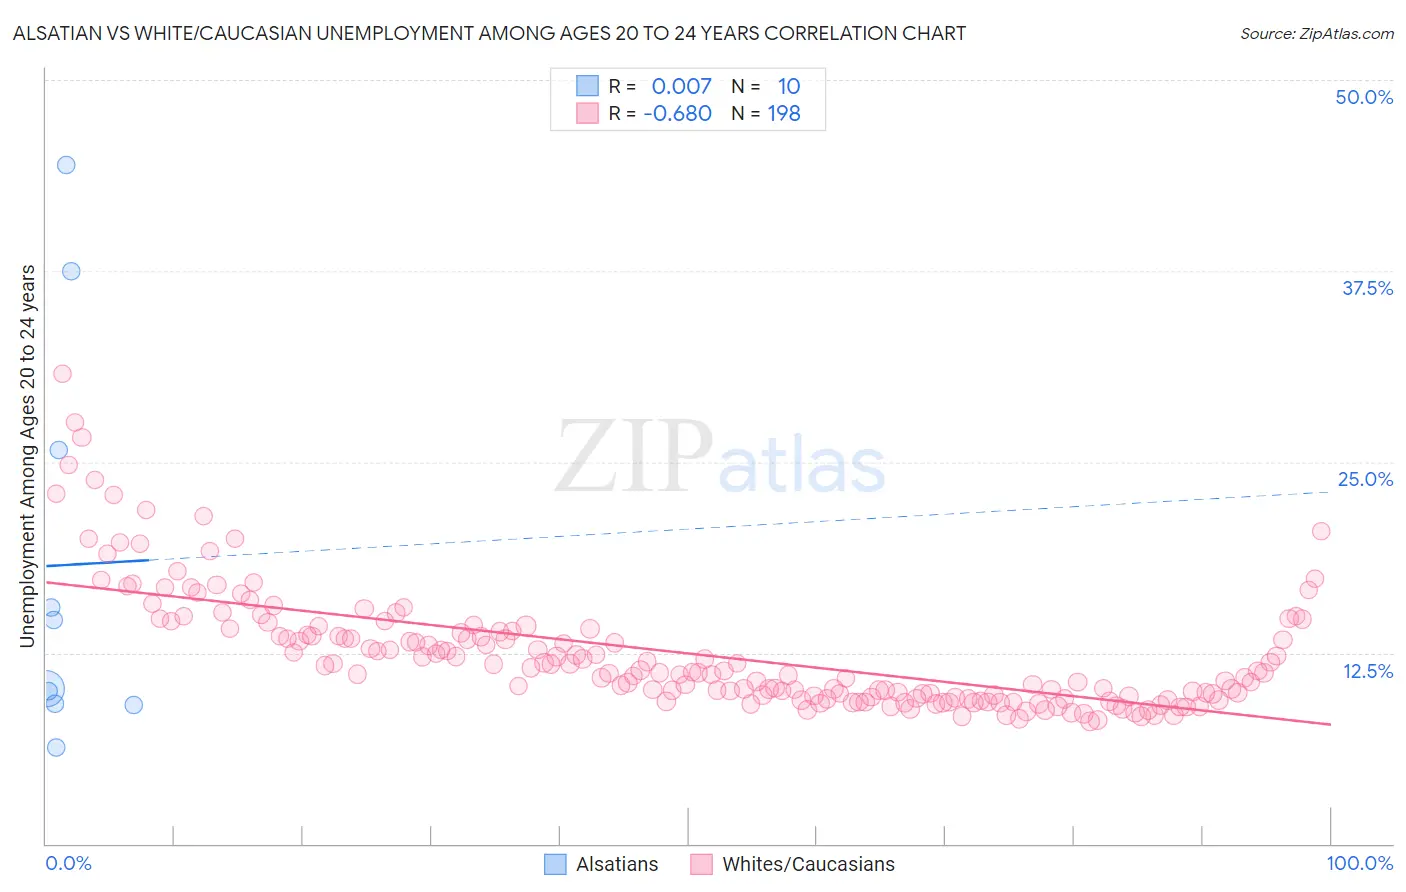
Alsatian vs White/Caucasian Unemployment Among Ages 20 to 24 years Correlation Chart
The statistical analysis conducted on geographies consisting of 81,720,132 people shows no correlation between the proportion of Alsatians and unemployment rate among population between the ages 20 and 24 in the United States with a correlation coefficient (R) of 0.007 and weighted average of 10.3%. Similarly, the statistical analysis conducted on geographies consisting of 530,440,022 people shows a significant negative correlation between the proportion of Whites/Caucasians and unemployment rate among population between the ages 20 and 24 in the United States with a correlation coefficient (R) of -0.680 and weighted average of 10.1%, a difference of 2.2%.
Unemployment Among Ages 20 to 24 years Correlation Summary
| Measurement | Alsatian | White/Caucasian |
| Minimum | 6.3% | 8.0% |
| Maximum | 44.4% | 30.8% |
| Range | 38.1% | 22.8% |
| Mean | 18.2% | 12.5% |
| Median | 12.4% | 11.3% |
| Interquartile 25% (IQ1) | 9.1% | 9.6% |
| Interquartile 75% (IQ3) | 25.8% | 13.9% |
| Interquartile Range (IQR) | 16.7% | 4.3% |
| Standard Deviation (Sample) | 13.2% | 3.9% |
| Standard Deviation (Population) | 12.5% | 3.9% |
Similar Demographics by Unemployment Among Ages 20 to 24 years
Demographics Similar to Alsatians by Unemployment Among Ages 20 to 24 years
In terms of unemployment among ages 20 to 24 years, the demographic groups most similar to Alsatians are Immigrants from Czechoslovakia (10.3%, a difference of 0.010%), Tlingit-Haida (10.3%, a difference of 0.030%), Immigrants from Turkey (10.3%, a difference of 0.040%), Okinawan (10.3%, a difference of 0.050%), and Potawatomi (10.3%, a difference of 0.060%).
| Demographics | Rating | Rank | Unemployment Among Ages 20 to 24 years |
| Immigrants | Eastern Asia | 52.7 /100 | #171 | Average 10.3% |
| Koreans | 51.9 /100 | #172 | Average 10.3% |
| Immigrants | Sweden | 50.8 /100 | #173 | Average 10.3% |
| Ukrainians | 50.0 /100 | #174 | Average 10.3% |
| Samoans | 45.4 /100 | #175 | Average 10.3% |
| Potawatomi | 42.0 /100 | #176 | Average 10.3% |
| Immigrants | Czechoslovakia | 40.8 /100 | #177 | Average 10.3% |
| Alsatians | 40.5 /100 | #178 | Average 10.3% |
| Tlingit-Haida | 39.7 /100 | #179 | Fair 10.3% |
| Immigrants | Turkey | 39.3 /100 | #180 | Fair 10.3% |
| Okinawans | 39.1 /100 | #181 | Fair 10.3% |
| Immigrants | Germany | 38.1 /100 | #182 | Fair 10.4% |
| Immigrants | Egypt | 37.4 /100 | #183 | Fair 10.4% |
| Greeks | 37.2 /100 | #184 | Fair 10.4% |
| Syrians | 35.6 /100 | #185 | Fair 10.4% |
Demographics Similar to Whites/Caucasians by Unemployment Among Ages 20 to 24 years
In terms of unemployment among ages 20 to 24 years, the demographic groups most similar to Whites/Caucasians are Immigrants from Iraq (10.1%, a difference of 0.020%), South African (10.1%, a difference of 0.040%), Immigrants from Canada (10.1%, a difference of 0.070%), Immigrants from Japan (10.1%, a difference of 0.070%), and French (10.1%, a difference of 0.080%).
| Demographics | Rating | Rank | Unemployment Among Ages 20 to 24 years |
| Immigrants | Morocco | 90.5 /100 | #115 | Exceptional 10.1% |
| Basques | 89.8 /100 | #116 | Excellent 10.1% |
| Immigrants | Uruguay | 89.6 /100 | #117 | Excellent 10.1% |
| Paraguayans | 88.6 /100 | #118 | Excellent 10.1% |
| French | 88.2 /100 | #119 | Excellent 10.1% |
| Immigrants | Canada | 88.2 /100 | #120 | Excellent 10.1% |
| South Africans | 87.8 /100 | #121 | Excellent 10.1% |
| Whites/Caucasians | 87.4 /100 | #122 | Excellent 10.1% |
| Immigrants | Iraq | 87.1 /100 | #123 | Excellent 10.1% |
| Immigrants | Japan | 86.5 /100 | #124 | Excellent 10.1% |
| Spanish | 86.1 /100 | #125 | Excellent 10.1% |
| Jordanians | 86.1 /100 | #126 | Excellent 10.1% |
| Immigrants | Norway | 85.3 /100 | #127 | Excellent 10.1% |
| Immigrants | Brazil | 84.9 /100 | #128 | Excellent 10.1% |
| Immigrants | South Central Asia | 84.6 /100 | #129 | Excellent 10.1% |