Black/African American vs Lumbee Unemployment Among Ages 20 to 24 years
COMPARE
Black/African American
Lumbee
Unemployment Among Ages 20 to 24 years
Unemployment Among Ages 20 to 24 years Comparison
Blacks/African Americans
Lumbee
12.7%
UNEMPLOYMENT AMONG AGES 20 TO 24 YEARS
0.0/ 100
METRIC RATING
314th/ 347
METRIC RANK
12.0%
UNEMPLOYMENT AMONG AGES 20 TO 24 YEARS
0.0/ 100
METRIC RATING
298th/ 347
METRIC RANK
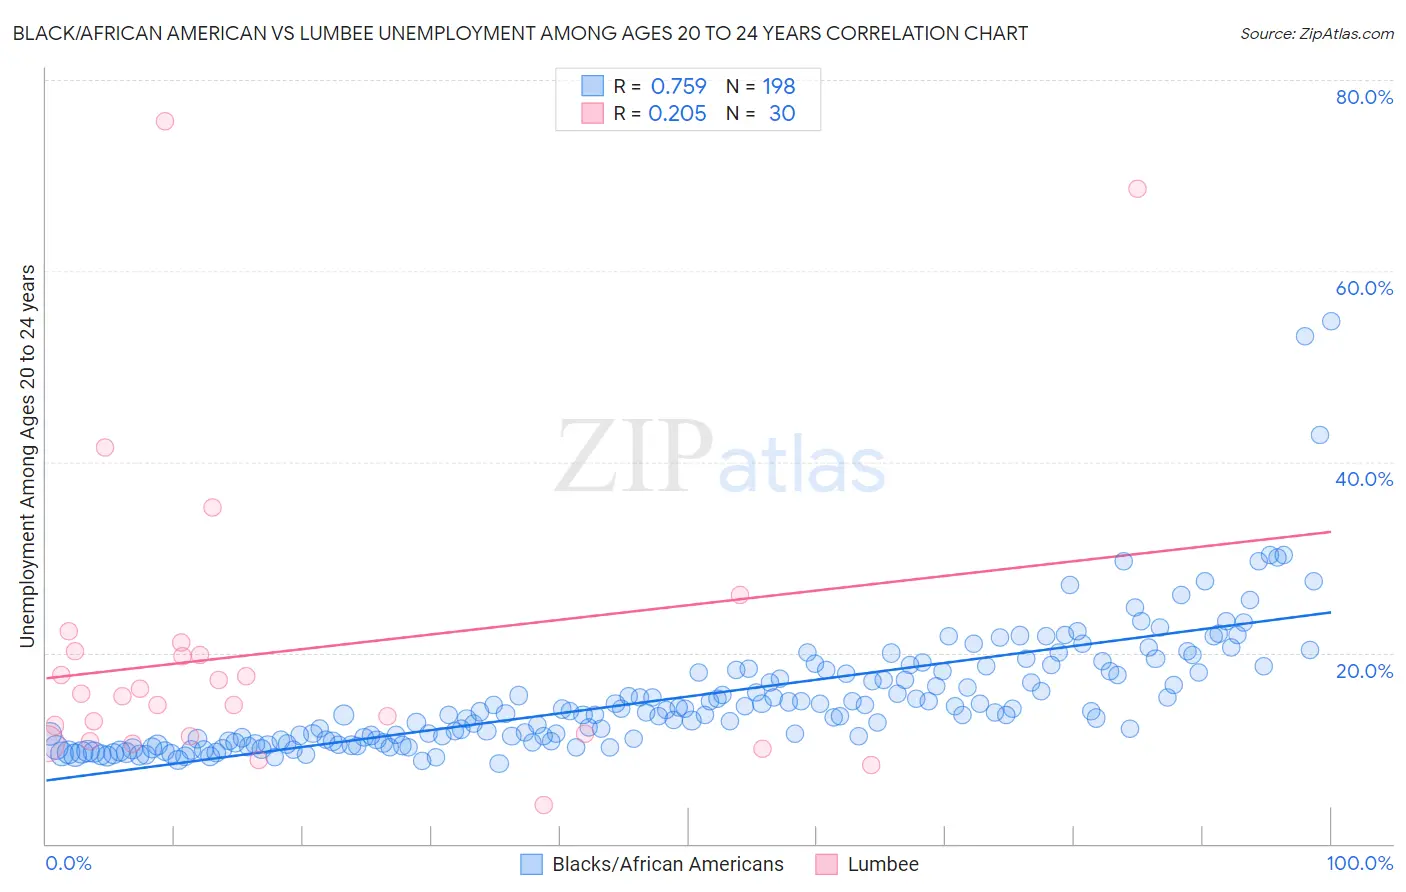
Black/African American vs Lumbee Unemployment Among Ages 20 to 24 years Correlation Chart
The statistical analysis conducted on geographies consisting of 523,414,021 people shows a strong positive correlation between the proportion of Blacks/African Americans and unemployment rate among population between the ages 20 and 24 in the United States with a correlation coefficient (R) of 0.759 and weighted average of 12.7%. Similarly, the statistical analysis conducted on geographies consisting of 91,069,259 people shows a weak positive correlation between the proportion of Lumbee and unemployment rate among population between the ages 20 and 24 in the United States with a correlation coefficient (R) of 0.205 and weighted average of 12.0%, a difference of 5.8%.
Unemployment Among Ages 20 to 24 years Correlation Summary
| Measurement | Black/African American | Lumbee |
| Minimum | 8.4% | 4.0% |
| Maximum | 54.7% | 75.7% |
| Range | 46.3% | 71.7% |
| Mean | 15.4% | 20.1% |
| Median | 13.7% | 15.5% |
| Interquartile 25% (IQ1) | 10.7% | 11.3% |
| Interquartile 75% (IQ3) | 18.1% | 20.2% |
| Interquartile Range (IQR) | 7.4% | 8.9% |
| Standard Deviation (Sample) | 6.7% | 16.1% |
| Standard Deviation (Population) | 6.6% | 15.8% |
Demographics Similar to Blacks/African Americans and Lumbee by Unemployment Among Ages 20 to 24 years
In terms of unemployment among ages 20 to 24 years, the demographic groups most similar to Blacks/African Americans are Shoshone (12.7%, a difference of 0.19%), West Indian (12.8%, a difference of 0.21%), Immigrants from Dominica (12.8%, a difference of 0.68%), Houma (12.6%, a difference of 0.73%), and Vietnamese (12.6%, a difference of 0.88%). Similarly, the demographic groups most similar to Lumbee are Apache (12.0%, a difference of 0.030%), Spanish American Indian (12.1%, a difference of 0.19%), Blackfeet (12.0%, a difference of 0.45%), Cajun (12.0%, a difference of 0.47%), and Immigrants from Sierra Leone (12.1%, a difference of 0.67%).
| Demographics | Rating | Rank | Unemployment Among Ages 20 to 24 years |
| Cajuns | 0.0 /100 | #296 | Tragic 12.0% |
| Blackfeet | 0.0 /100 | #297 | Tragic 12.0% |
| Lumbee | 0.0 /100 | #298 | Tragic 12.0% |
| Apache | 0.0 /100 | #299 | Tragic 12.0% |
| Spanish American Indians | 0.0 /100 | #300 | Tragic 12.1% |
| Immigrants | Sierra Leone | 0.0 /100 | #301 | Tragic 12.1% |
| Immigrants | Cabo Verde | 0.0 /100 | #302 | Tragic 12.2% |
| Haitians | 0.0 /100 | #303 | Tragic 12.2% |
| Immigrants | West Indies | 0.0 /100 | #304 | Tragic 12.3% |
| Chippewa | 0.0 /100 | #305 | Tragic 12.3% |
| Immigrants | Haiti | 0.0 /100 | #306 | Tragic 12.4% |
| Bermudans | 0.0 /100 | #307 | Tragic 12.5% |
| Tohono O'odham | 0.0 /100 | #308 | Tragic 12.5% |
| Immigrants | Bangladesh | 0.0 /100 | #309 | Tragic 12.6% |
| Jamaicans | 0.0 /100 | #310 | Tragic 12.6% |
| Vietnamese | 0.0 /100 | #311 | Tragic 12.6% |
| Houma | 0.0 /100 | #312 | Tragic 12.6% |
| Shoshone | 0.0 /100 | #313 | Tragic 12.7% |
| Blacks/African Americans | 0.0 /100 | #314 | Tragic 12.7% |
| West Indians | 0.0 /100 | #315 | Tragic 12.8% |
| Immigrants | Dominica | 0.0 /100 | #316 | Tragic 12.8% |