Immigrants from Indonesia vs White/Caucasian Unemployment Among Ages 20 to 24 years
COMPARE
Immigrants from Indonesia
White/Caucasian
Unemployment Among Ages 20 to 24 years
Unemployment Among Ages 20 to 24 years Comparison
Immigrants from Indonesia
Whites/Caucasians
10.1%
UNEMPLOYMENT AMONG AGES 20 TO 24 YEARS
92.7/ 100
METRIC RATING
111th/ 347
METRIC RANK
10.1%
UNEMPLOYMENT AMONG AGES 20 TO 24 YEARS
87.4/ 100
METRIC RATING
122nd/ 347
METRIC RANK
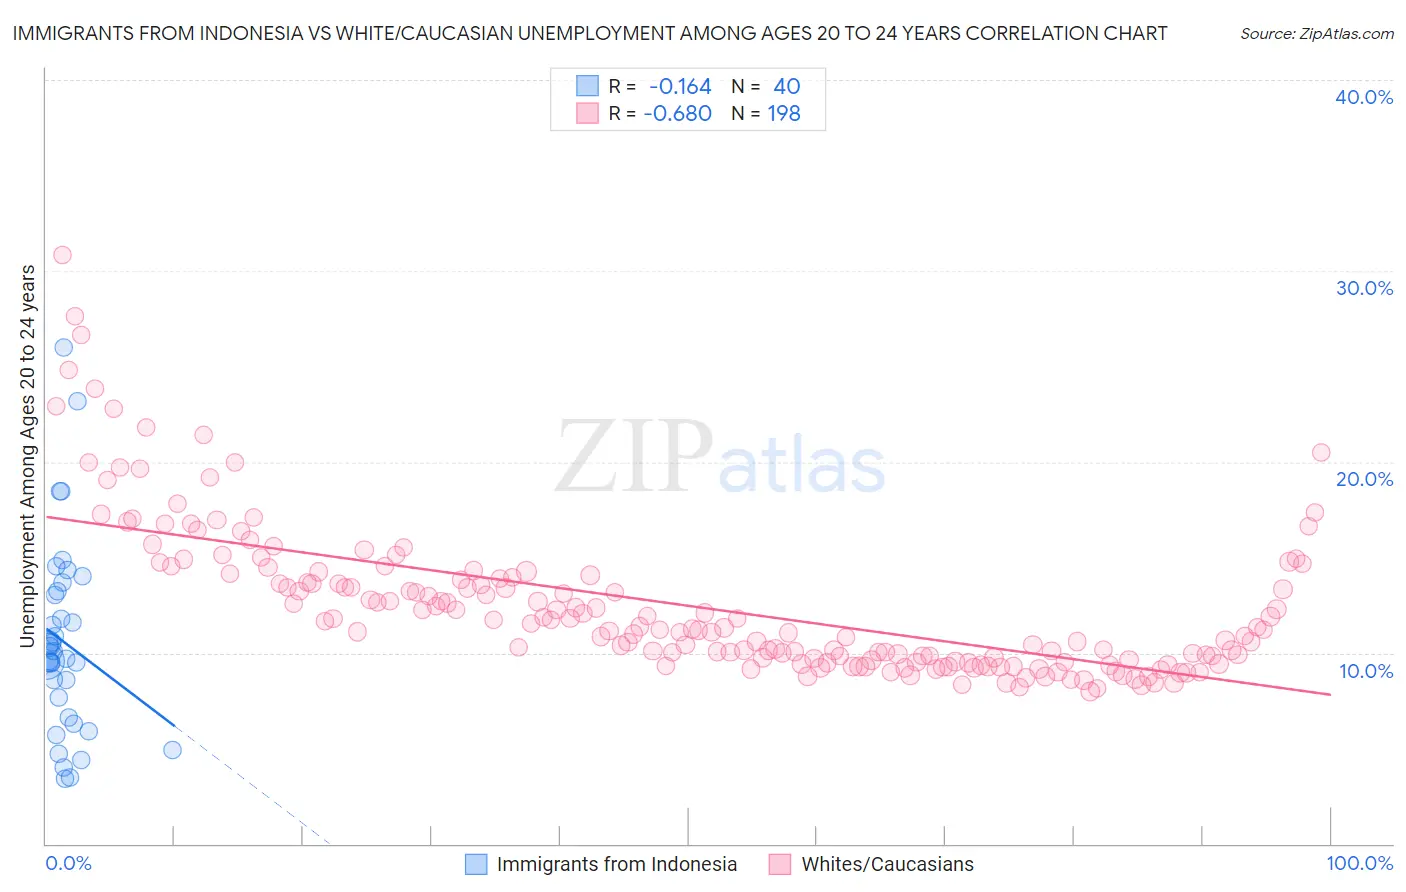
Immigrants from Indonesia vs White/Caucasian Unemployment Among Ages 20 to 24 years Correlation Chart
The statistical analysis conducted on geographies consisting of 213,434,370 people shows a poor negative correlation between the proportion of Immigrants from Indonesia and unemployment rate among population between the ages 20 and 24 in the United States with a correlation coefficient (R) of -0.164 and weighted average of 10.1%. Similarly, the statistical analysis conducted on geographies consisting of 530,440,022 people shows a significant negative correlation between the proportion of Whites/Caucasians and unemployment rate among population between the ages 20 and 24 in the United States with a correlation coefficient (R) of -0.680 and weighted average of 10.1%, a difference of 0.58%.
Unemployment Among Ages 20 to 24 years Correlation Summary
| Measurement | Immigrants from Indonesia | White/Caucasian |
| Minimum | 3.4% | 8.0% |
| Maximum | 26.0% | 30.8% |
| Range | 22.6% | 22.8% |
| Mean | 10.6% | 12.5% |
| Median | 9.9% | 11.3% |
| Interquartile 25% (IQ1) | 7.1% | 9.6% |
| Interquartile 75% (IQ3) | 13.1% | 13.9% |
| Interquartile Range (IQR) | 6.0% | 4.3% |
| Standard Deviation (Sample) | 5.0% | 3.9% |
| Standard Deviation (Population) | 4.9% | 3.9% |
Demographics Similar to Immigrants from Indonesia and Whites/Caucasians by Unemployment Among Ages 20 to 24 years
In terms of unemployment among ages 20 to 24 years, the demographic groups most similar to Immigrants from Indonesia are Northern European (10.1%, a difference of 0.010%), German Russian (10.1%, a difference of 0.040%), Immigrants from Spain (10.1%, a difference of 0.060%), Immigrants from Latvia (10.1%, a difference of 0.070%), and Filipino (10.1%, a difference of 0.070%). Similarly, the demographic groups most similar to Whites/Caucasians are Immigrants from Iraq (10.1%, a difference of 0.020%), South African (10.1%, a difference of 0.040%), Immigrants from Canada (10.1%, a difference of 0.070%), Immigrants from Japan (10.1%, a difference of 0.070%), and French (10.1%, a difference of 0.080%).
| Demographics | Rating | Rank | Unemployment Among Ages 20 to 24 years |
| Pennsylvania Germans | 93.9 /100 | #106 | Exceptional 10.0% |
| Iroquois | 93.4 /100 | #107 | Exceptional 10.1% |
| Immigrants | Latvia | 93.2 /100 | #108 | Exceptional 10.1% |
| Filipinos | 93.2 /100 | #109 | Exceptional 10.1% |
| Immigrants | Spain | 93.1 /100 | #110 | Exceptional 10.1% |
| Immigrants | Indonesia | 92.7 /100 | #111 | Exceptional 10.1% |
| Northern Europeans | 92.7 /100 | #112 | Exceptional 10.1% |
| German Russians | 92.4 /100 | #113 | Exceptional 10.1% |
| Ottawa | 90.8 /100 | #114 | Exceptional 10.1% |
| Immigrants | Morocco | 90.5 /100 | #115 | Exceptional 10.1% |
| Basques | 89.8 /100 | #116 | Excellent 10.1% |
| Immigrants | Uruguay | 89.6 /100 | #117 | Excellent 10.1% |
| Paraguayans | 88.6 /100 | #118 | Excellent 10.1% |
| French | 88.2 /100 | #119 | Excellent 10.1% |
| Immigrants | Canada | 88.2 /100 | #120 | Excellent 10.1% |
| South Africans | 87.8 /100 | #121 | Excellent 10.1% |
| Whites/Caucasians | 87.4 /100 | #122 | Excellent 10.1% |
| Immigrants | Iraq | 87.1 /100 | #123 | Excellent 10.1% |
| Immigrants | Japan | 86.5 /100 | #124 | Excellent 10.1% |
| Spanish | 86.1 /100 | #125 | Excellent 10.1% |
| Jordanians | 86.1 /100 | #126 | Excellent 10.1% |