Black/African American vs White/Caucasian Seniors Poverty Over the Age of 75
COMPARE
Black/African American
White/Caucasian
Seniors Poverty Over the Age of 75
Seniors Poverty Over the Age of 75 Comparison
Blacks/African Americans
Whites/Caucasians
14.6%
SENIORS POVERTY OVER THE AGE OF 75
0.0/ 100
METRIC RATING
279th/ 347
METRIC RANK
11.4%
SENIORS POVERTY OVER THE AGE OF 75
95.5/ 100
METRIC RATING
77th/ 347
METRIC RANK
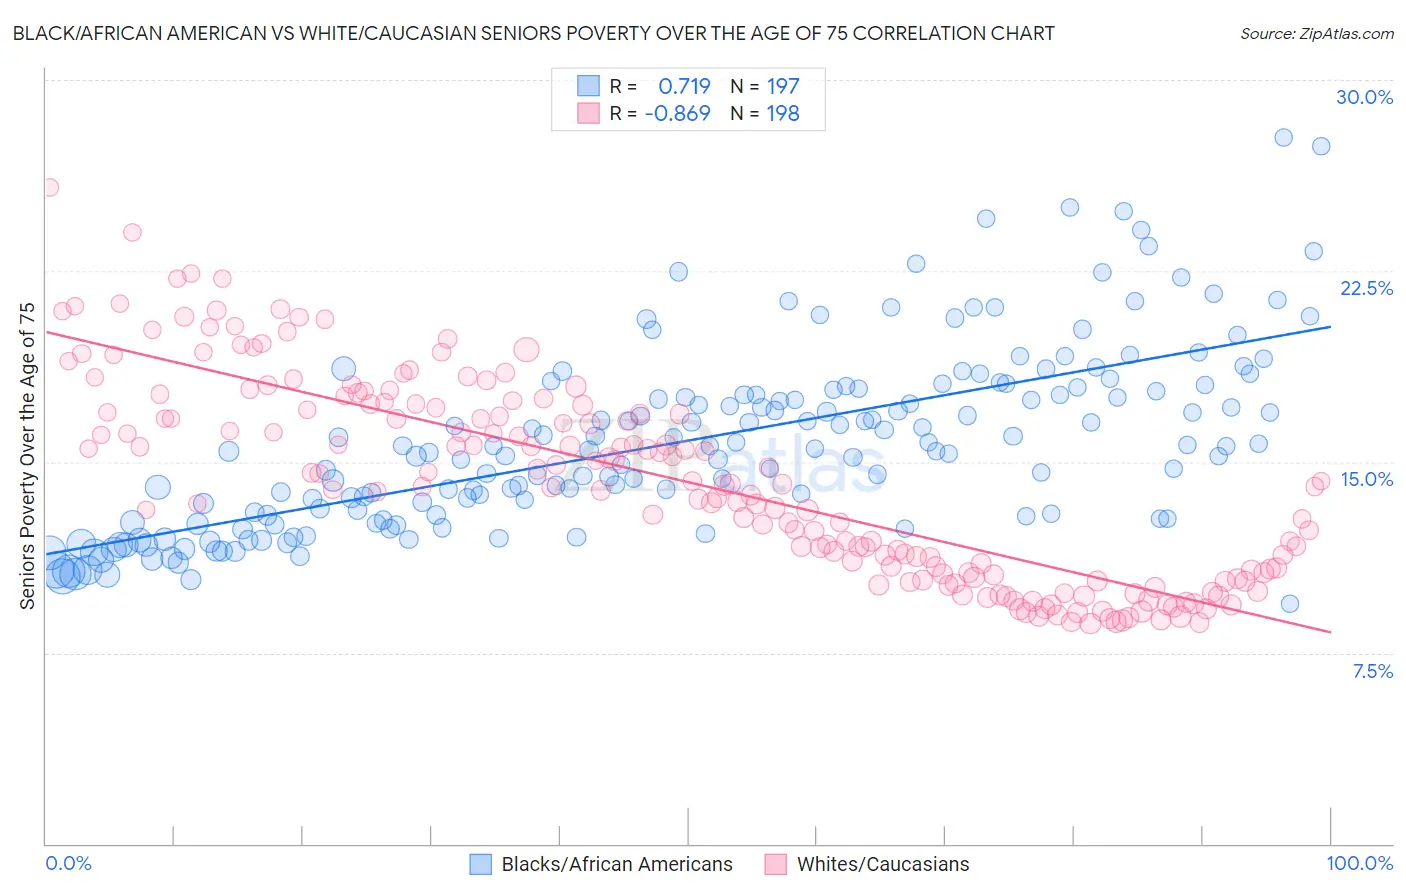
Black/African American vs White/Caucasian Seniors Poverty Over the Age of 75 Correlation Chart
The statistical analysis conducted on geographies consisting of 551,157,628 people shows a strong positive correlation between the proportion of Blacks/African Americans and poverty level among seniors over the age of 75 in the United States with a correlation coefficient (R) of 0.719 and weighted average of 14.6%. Similarly, the statistical analysis conducted on geographies consisting of 563,847,839 people shows a very strong negative correlation between the proportion of Whites/Caucasians and poverty level among seniors over the age of 75 in the United States with a correlation coefficient (R) of -0.869 and weighted average of 11.4%, a difference of 28.1%.
Seniors Poverty Over the Age of 75 Correlation Summary
| Measurement | Black/African American | White/Caucasian |
| Minimum | 9.4% | 8.6% |
| Maximum | 27.7% | 25.8% |
| Range | 18.3% | 17.1% |
| Mean | 15.8% | 14.2% |
| Median | 15.4% | 14.0% |
| Interquartile 25% (IQ1) | 12.9% | 10.6% |
| Interquartile 75% (IQ3) | 17.8% | 17.1% |
| Interquartile Range (IQR) | 4.9% | 6.5% |
| Standard Deviation (Sample) | 3.5% | 3.9% |
| Standard Deviation (Population) | 3.5% | 3.9% |
Similar Demographics by Seniors Poverty Over the Age of 75
Demographics Similar to Blacks/African Americans by Seniors Poverty Over the Age of 75
In terms of seniors poverty over the age of 75, the demographic groups most similar to Blacks/African Americans are Immigrants from Colombia (14.6%, a difference of 0.21%), Central American (14.7%, a difference of 0.64%), Belizean (14.8%, a difference of 0.76%), Immigrants from Senegal (14.8%, a difference of 0.93%), and Senegalese (14.5%, a difference of 0.99%).
| Demographics | Rating | Rank | Seniors Poverty Over the Age of 75 |
| Mexicans | 0.0 /100 | #272 | Tragic 14.4% |
| Immigrants | South America | 0.0 /100 | #273 | Tragic 14.4% |
| Immigrants | Bahamas | 0.0 /100 | #274 | Tragic 14.4% |
| Immigrants | El Salvador | 0.0 /100 | #275 | Tragic 14.5% |
| Soviet Union | 0.0 /100 | #276 | Tragic 14.5% |
| Senegalese | 0.0 /100 | #277 | Tragic 14.5% |
| Immigrants | Colombia | 0.0 /100 | #278 | Tragic 14.6% |
| Blacks/African Americans | 0.0 /100 | #279 | Tragic 14.6% |
| Central Americans | 0.0 /100 | #280 | Tragic 14.7% |
| Belizeans | 0.0 /100 | #281 | Tragic 14.8% |
| Immigrants | Senegal | 0.0 /100 | #282 | Tragic 14.8% |
| Guatemalans | 0.0 /100 | #283 | Tragic 14.8% |
| Cheyenne | 0.0 /100 | #284 | Tragic 14.9% |
| Immigrants | Mexico | 0.0 /100 | #285 | Tragic 14.9% |
| Immigrants | Central America | 0.0 /100 | #286 | Tragic 15.0% |
Demographics Similar to Whites/Caucasians by Seniors Poverty Over the Age of 75
In terms of seniors poverty over the age of 75, the demographic groups most similar to Whites/Caucasians are Macedonian (11.4%, a difference of 0.010%), Filipino (11.4%, a difference of 0.020%), Alaska Native (11.4%, a difference of 0.070%), French Canadian (11.4%, a difference of 0.080%), and Palestinian (11.4%, a difference of 0.15%).
| Demographics | Rating | Rank | Seniors Poverty Over the Age of 75 |
| Immigrants | South Central Asia | 96.4 /100 | #70 | Exceptional 11.4% |
| Osage | 96.3 /100 | #71 | Exceptional 11.4% |
| Sierra Leoneans | 96.1 /100 | #72 | Exceptional 11.4% |
| Immigrants | Micronesia | 96.0 /100 | #73 | Exceptional 11.4% |
| Delaware | 96.0 /100 | #74 | Exceptional 11.4% |
| Palestinians | 95.8 /100 | #75 | Exceptional 11.4% |
| French Canadians | 95.7 /100 | #76 | Exceptional 11.4% |
| Whites/Caucasians | 95.5 /100 | #77 | Exceptional 11.4% |
| Macedonians | 95.5 /100 | #78 | Exceptional 11.4% |
| Filipinos | 95.5 /100 | #79 | Exceptional 11.4% |
| Alaska Natives | 95.4 /100 | #80 | Exceptional 11.4% |
| Basques | 95.1 /100 | #81 | Exceptional 11.5% |
| Iranians | 95.1 /100 | #82 | Exceptional 11.5% |
| Immigrants | South Africa | 94.9 /100 | #83 | Exceptional 11.5% |
| Immigrants | Iraq | 94.9 /100 | #84 | Exceptional 11.5% |