Blackfeet vs Comanche Unemployment
COMPARE
Blackfeet
Comanche
Unemployment
Unemployment Comparison
Blackfeet
Comanche
5.8%
UNEMPLOYMENT
0.1/ 100
METRIC RATING
270th/ 347
METRIC RANK
5.5%
UNEMPLOYMENT
4.9/ 100
METRIC RATING
232nd/ 347
METRIC RANK
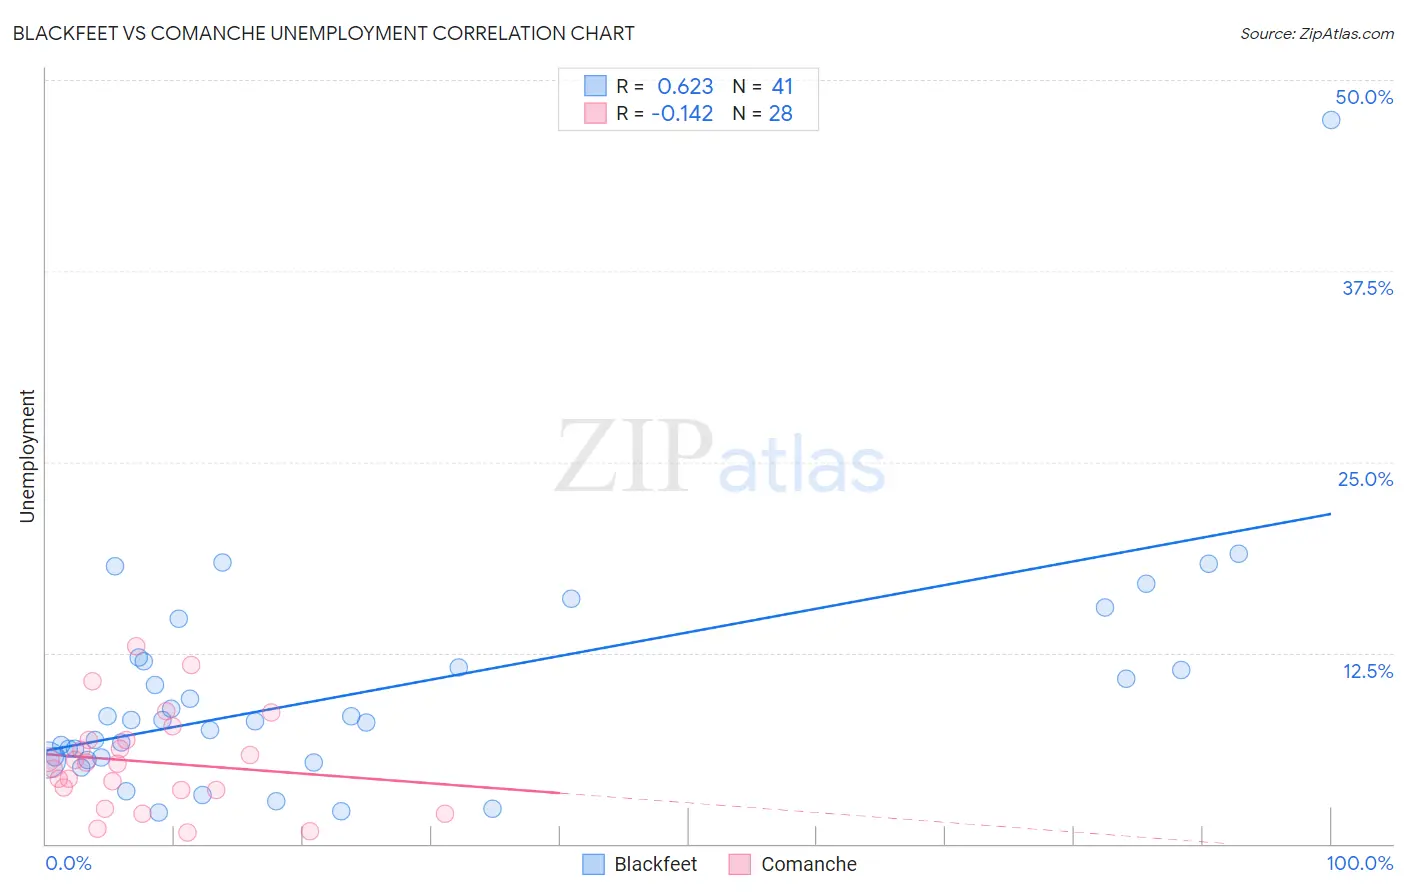
Blackfeet vs Comanche Unemployment Correlation Chart
The statistical analysis conducted on geographies consisting of 309,227,999 people shows a significant positive correlation between the proportion of Blackfeet and unemployment in the United States with a correlation coefficient (R) of 0.623 and weighted average of 5.8%. Similarly, the statistical analysis conducted on geographies consisting of 109,712,391 people shows a poor negative correlation between the proportion of Comanche and unemployment in the United States with a correlation coefficient (R) of -0.142 and weighted average of 5.5%, a difference of 6.4%.
Unemployment Correlation Summary
| Measurement | Blackfeet | Comanche |
| Minimum | 2.0% | 0.70% |
| Maximum | 47.4% | 12.9% |
| Range | 45.4% | 12.2% |
| Mean | 10.0% | 5.4% |
| Median | 8.1% | 5.3% |
| Interquartile 25% (IQ1) | 5.6% | 3.5% |
| Interquartile 75% (IQ3) | 12.1% | 6.8% |
| Interquartile Range (IQR) | 6.5% | 3.3% |
| Standard Deviation (Sample) | 7.7% | 3.1% |
| Standard Deviation (Population) | 7.6% | 3.1% |
Similar Demographics by Unemployment
Demographics Similar to Blackfeet by Unemployment
In terms of unemployment, the demographic groups most similar to Blackfeet are Immigrants from El Salvador (5.8%, a difference of 0.080%), Immigrants from Sierra Leone (5.8%, a difference of 0.090%), Immigrants from Nigeria (5.8%, a difference of 0.13%), Mexican American Indian (5.8%, a difference of 0.20%), and Mexican (5.9%, a difference of 0.23%).
| Demographics | Rating | Rank | Unemployment |
| Salvadorans | 0.1 /100 | #263 | Tragic 5.8% |
| Immigrants | Liberia | 0.1 /100 | #264 | Tragic 5.8% |
| Nigerians | 0.1 /100 | #265 | Tragic 5.8% |
| Mexican American Indians | 0.1 /100 | #266 | Tragic 5.8% |
| Immigrants | Nigeria | 0.1 /100 | #267 | Tragic 5.8% |
| Immigrants | Sierra Leone | 0.1 /100 | #268 | Tragic 5.8% |
| Immigrants | El Salvador | 0.1 /100 | #269 | Tragic 5.8% |
| Blackfeet | 0.1 /100 | #270 | Tragic 5.8% |
| Mexicans | 0.1 /100 | #271 | Tragic 5.9% |
| Hispanics or Latinos | 0.0 /100 | #272 | Tragic 5.9% |
| Immigrants | Fiji | 0.0 /100 | #273 | Tragic 5.9% |
| Bahamians | 0.0 /100 | #274 | Tragic 5.9% |
| Immigrants | Latin America | 0.0 /100 | #275 | Tragic 5.9% |
| Immigrants | Central America | 0.0 /100 | #276 | Tragic 6.0% |
| Armenians | 0.0 /100 | #277 | Tragic 6.0% |
Demographics Similar to Comanche by Unemployment
In terms of unemployment, the demographic groups most similar to Comanche are Immigrants from Africa (5.5%, a difference of 0.0%), Immigrants from Syria (5.5%, a difference of 0.050%), Panamanian (5.5%, a difference of 0.080%), Hawaiian (5.5%, a difference of 0.13%), and Ottawa (5.5%, a difference of 0.13%).
| Demographics | Rating | Rank | Unemployment |
| South American Indians | 7.8 /100 | #225 | Tragic 5.5% |
| Samoans | 7.1 /100 | #226 | Tragic 5.5% |
| Immigrants | Lebanon | 7.0 /100 | #227 | Tragic 5.5% |
| Guamanians/Chamorros | 6.3 /100 | #228 | Tragic 5.5% |
| Hawaiians | 5.4 /100 | #229 | Tragic 5.5% |
| Ottawa | 5.4 /100 | #230 | Tragic 5.5% |
| Immigrants | Africa | 4.9 /100 | #231 | Tragic 5.5% |
| Comanche | 4.9 /100 | #232 | Tragic 5.5% |
| Immigrants | Syria | 4.8 /100 | #233 | Tragic 5.5% |
| Panamanians | 4.7 /100 | #234 | Tragic 5.5% |
| Immigrants | Panama | 3.4 /100 | #235 | Tragic 5.5% |
| Immigrants | Cambodia | 3.3 /100 | #236 | Tragic 5.5% |
| Moroccans | 3.2 /100 | #237 | Tragic 5.5% |
| Immigrants | Western Asia | 2.8 /100 | #238 | Tragic 5.5% |
| Immigrants | Immigrants | 2.6 /100 | #239 | Tragic 5.5% |