Blackfeet vs Comanche 2nd Grade
COMPARE
Blackfeet
Comanche
2nd Grade
2nd Grade Comparison
Blackfeet
Comanche
98.0%
2ND GRADE
87.5/ 100
METRIC RATING
139th/ 347
METRIC RANK
97.9%
2ND GRADE
62.8/ 100
METRIC RATING
159th/ 347
METRIC RANK
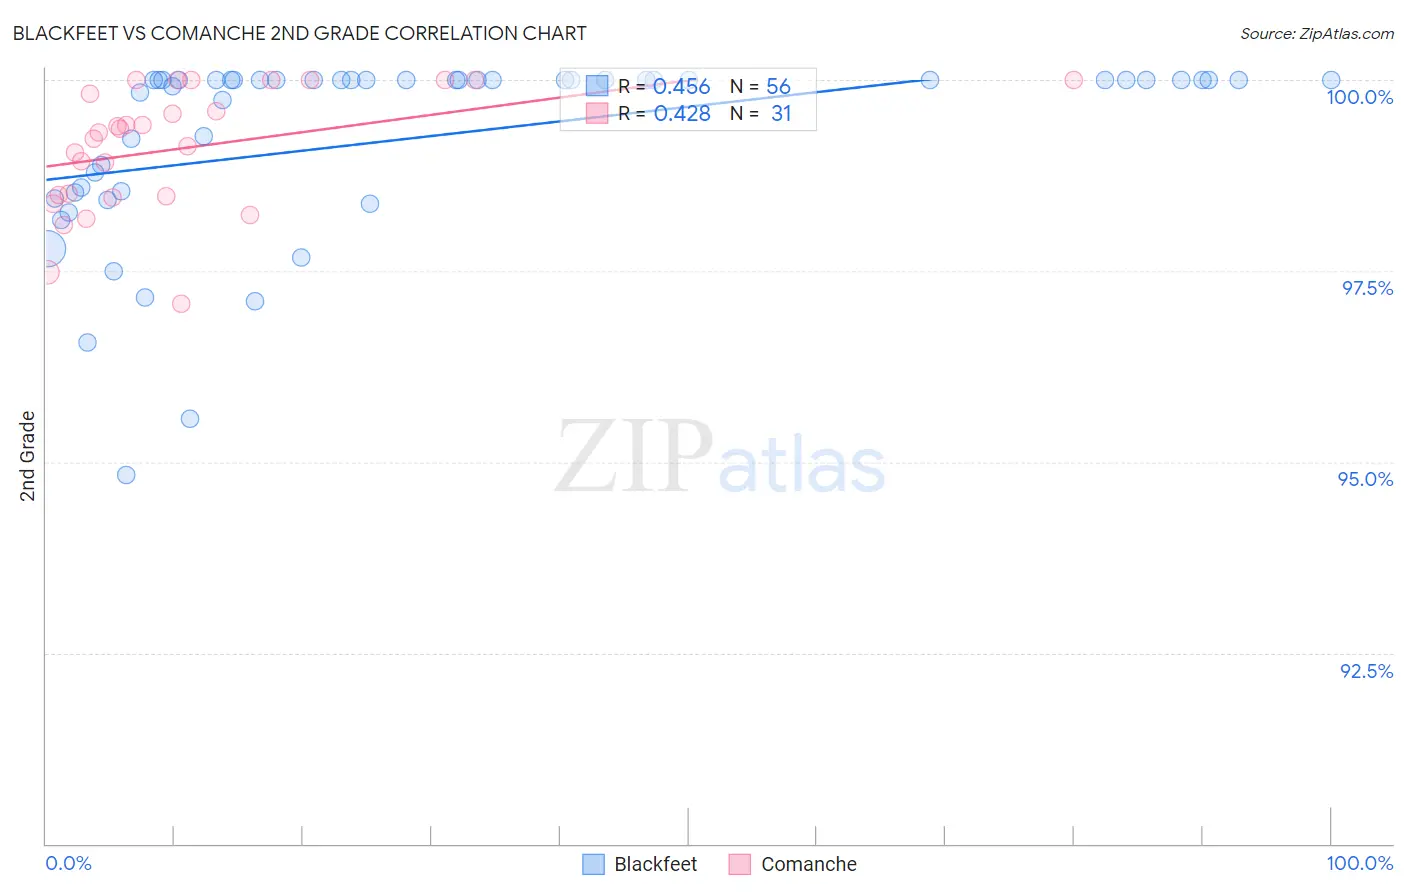
Blackfeet vs Comanche 2nd Grade Correlation Chart
The statistical analysis conducted on geographies consisting of 309,580,957 people shows a moderate positive correlation between the proportion of Blackfeet and percentage of population with at least 2nd grade education in the United States with a correlation coefficient (R) of 0.456 and weighted average of 98.0%. Similarly, the statistical analysis conducted on geographies consisting of 109,786,530 people shows a moderate positive correlation between the proportion of Comanche and percentage of population with at least 2nd grade education in the United States with a correlation coefficient (R) of 0.428 and weighted average of 97.9%, a difference of 0.11%.
2nd Grade Correlation Summary
| Measurement | Blackfeet | Comanche |
| Minimum | 94.8% | 97.1% |
| Maximum | 100.0% | 100.0% |
| Range | 5.2% | 2.9% |
| Mean | 99.2% | 99.1% |
| Median | 100.0% | 99.3% |
| Interquartile 25% (IQ1) | 98.5% | 98.5% |
| Interquartile 75% (IQ3) | 100.0% | 100.0% |
| Interquartile Range (IQR) | 1.5% | 1.5% |
| Standard Deviation (Sample) | 1.2% | 0.80% |
| Standard Deviation (Population) | 1.2% | 0.79% |
Demographics Similar to Blackfeet and Comanche by 2nd Grade
In terms of 2nd grade, the demographic groups most similar to Blackfeet are Palestinian (98.0%, a difference of 0.020%), Immigrants from Turkey (98.0%, a difference of 0.030%), Burmese (98.0%, a difference of 0.040%), Alsatian (98.0%, a difference of 0.040%), and Hmong (98.0%, a difference of 0.040%). Similarly, the demographic groups most similar to Comanche are Dutch West Indian (97.9%, a difference of 0.0%), Venezuelan (97.9%, a difference of 0.0%), Immigrants from Iran (97.9%, a difference of 0.0%), French American Indian (97.9%, a difference of 0.010%), and Immigrants from North Macedonia (97.9%, a difference of 0.020%).
| Demographics | Rating | Rank | 2nd Grade |
| Blackfeet | 87.5 /100 | #139 | Excellent 98.0% |
| Palestinians | 83.9 /100 | #140 | Excellent 98.0% |
| Immigrants | Turkey | 83.0 /100 | #141 | Excellent 98.0% |
| Burmese | 81.0 /100 | #142 | Excellent 98.0% |
| Alsatians | 80.5 /100 | #143 | Excellent 98.0% |
| Hmong | 80.0 /100 | #144 | Good 98.0% |
| Filipinos | 79.2 /100 | #145 | Good 98.0% |
| Immigrants | Israel | 78.0 /100 | #146 | Good 98.0% |
| Immigrants | Greece | 76.8 /100 | #147 | Good 98.0% |
| Jordanians | 74.5 /100 | #148 | Good 98.0% |
| Apache | 74.0 /100 | #149 | Good 97.9% |
| Immigrants | Moldova | 72.9 /100 | #150 | Good 97.9% |
| Soviet Union | 70.7 /100 | #151 | Good 97.9% |
| Immigrants | North Macedonia | 68.5 /100 | #152 | Good 97.9% |
| Immigrants | South Central Asia | 68.3 /100 | #153 | Good 97.9% |
| Marshallese | 67.7 /100 | #154 | Good 97.9% |
| French American Indians | 64.3 /100 | #155 | Good 97.9% |
| Dutch West Indians | 63.8 /100 | #156 | Good 97.9% |
| Venezuelans | 63.3 /100 | #157 | Good 97.9% |
| Immigrants | Iran | 62.8 /100 | #158 | Good 97.9% |
| Comanche | 62.8 /100 | #159 | Good 97.9% |