Blackfeet vs Indian (Asian) Unemployment
COMPARE
Blackfeet
Indian (Asian)
Unemployment
Unemployment Comparison
Blackfeet
Indians (Asian)
5.8%
UNEMPLOYMENT
0.1/ 100
METRIC RATING
270th/ 347
METRIC RANK
5.1%
UNEMPLOYMENT
81.6/ 100
METRIC RATING
147th/ 347
METRIC RANK
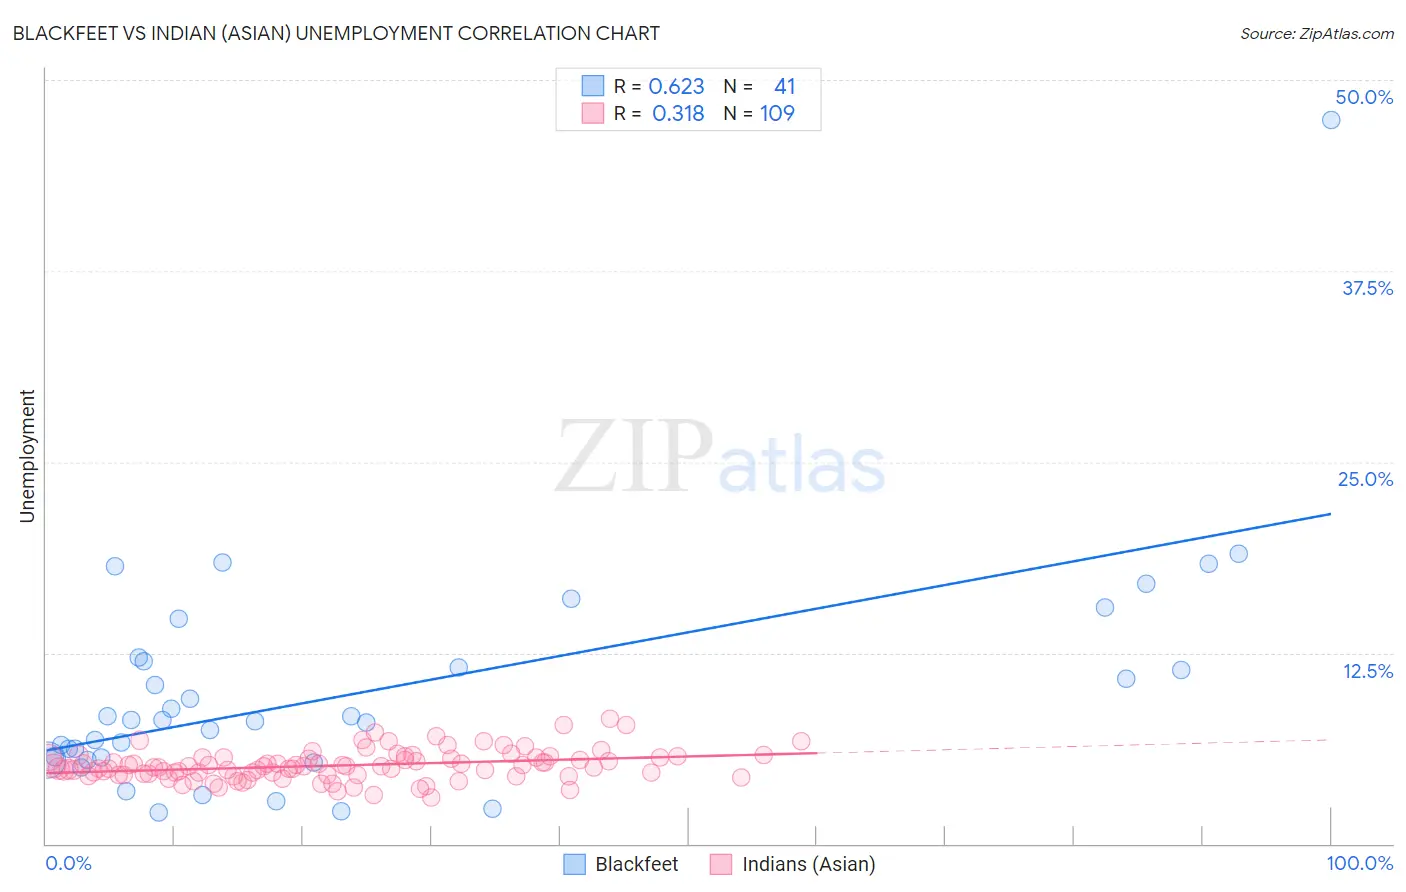
Blackfeet vs Indian (Asian) Unemployment Correlation Chart
The statistical analysis conducted on geographies consisting of 309,227,999 people shows a significant positive correlation between the proportion of Blackfeet and unemployment in the United States with a correlation coefficient (R) of 0.623 and weighted average of 5.8%. Similarly, the statistical analysis conducted on geographies consisting of 494,388,692 people shows a mild positive correlation between the proportion of Indians (Asian) and unemployment in the United States with a correlation coefficient (R) of 0.318 and weighted average of 5.1%, a difference of 13.8%.
Unemployment Correlation Summary
| Measurement | Blackfeet | Indian (Asian) |
| Minimum | 2.0% | 3.0% |
| Maximum | 47.4% | 8.2% |
| Range | 45.4% | 5.2% |
| Mean | 10.0% | 5.1% |
| Median | 8.1% | 5.0% |
| Interquartile 25% (IQ1) | 5.6% | 4.5% |
| Interquartile 75% (IQ3) | 12.1% | 5.6% |
| Interquartile Range (IQR) | 6.5% | 1.1% |
| Standard Deviation (Sample) | 7.7% | 0.97% |
| Standard Deviation (Population) | 7.6% | 0.96% |
Similar Demographics by Unemployment
Demographics Similar to Blackfeet by Unemployment
In terms of unemployment, the demographic groups most similar to Blackfeet are Immigrants from El Salvador (5.8%, a difference of 0.080%), Immigrants from Sierra Leone (5.8%, a difference of 0.090%), Immigrants from Nigeria (5.8%, a difference of 0.13%), Mexican American Indian (5.8%, a difference of 0.20%), and Mexican (5.9%, a difference of 0.23%).
| Demographics | Rating | Rank | Unemployment |
| Salvadorans | 0.1 /100 | #263 | Tragic 5.8% |
| Immigrants | Liberia | 0.1 /100 | #264 | Tragic 5.8% |
| Nigerians | 0.1 /100 | #265 | Tragic 5.8% |
| Mexican American Indians | 0.1 /100 | #266 | Tragic 5.8% |
| Immigrants | Nigeria | 0.1 /100 | #267 | Tragic 5.8% |
| Immigrants | Sierra Leone | 0.1 /100 | #268 | Tragic 5.8% |
| Immigrants | El Salvador | 0.1 /100 | #269 | Tragic 5.8% |
| Blackfeet | 0.1 /100 | #270 | Tragic 5.8% |
| Mexicans | 0.1 /100 | #271 | Tragic 5.9% |
| Hispanics or Latinos | 0.0 /100 | #272 | Tragic 5.9% |
| Immigrants | Fiji | 0.0 /100 | #273 | Tragic 5.9% |
| Bahamians | 0.0 /100 | #274 | Tragic 5.9% |
| Immigrants | Latin America | 0.0 /100 | #275 | Tragic 5.9% |
| Immigrants | Central America | 0.0 /100 | #276 | Tragic 6.0% |
| Armenians | 0.0 /100 | #277 | Tragic 6.0% |
Demographics Similar to Indians (Asian) by Unemployment
In terms of unemployment, the demographic groups most similar to Indians (Asian) are Immigrants from Asia (5.1%, a difference of 0.010%), Immigrants from Norway (5.1%, a difference of 0.020%), Indonesian (5.1%, a difference of 0.070%), Immigrants from Chile (5.1%, a difference of 0.12%), and Immigrants from Pakistan (5.1%, a difference of 0.17%).
| Demographics | Rating | Rank | Unemployment |
| Immigrants | Denmark | 84.3 /100 | #140 | Excellent 5.1% |
| Palestinians | 83.4 /100 | #141 | Excellent 5.1% |
| Immigrants | Pakistan | 83.2 /100 | #142 | Excellent 5.1% |
| Immigrants | Chile | 82.8 /100 | #143 | Excellent 5.1% |
| Indonesians | 82.3 /100 | #144 | Excellent 5.1% |
| Immigrants | Norway | 81.8 /100 | #145 | Excellent 5.1% |
| Immigrants | Asia | 81.8 /100 | #146 | Excellent 5.1% |
| Indians (Asian) | 81.6 /100 | #147 | Excellent 5.1% |
| Immigrants | Italy | 79.1 /100 | #148 | Good 5.1% |
| Syrians | 77.7 /100 | #149 | Good 5.2% |
| Potawatomi | 76.2 /100 | #150 | Good 5.2% |
| Immigrants | Eastern Europe | 75.3 /100 | #151 | Good 5.2% |
| Immigrants | Hong Kong | 75.2 /100 | #152 | Good 5.2% |
| Egyptians | 75.2 /100 | #153 | Good 5.2% |
| Immigrants | China | 74.7 /100 | #154 | Good 5.2% |