Blackfeet vs Immigrants from Czechoslovakia Unemployment
COMPARE
Blackfeet
Immigrants from Czechoslovakia
Unemployment
Unemployment Comparison
Blackfeet
Immigrants from Czechoslovakia
5.8%
UNEMPLOYMENT
0.1/ 100
METRIC RATING
270th/ 347
METRIC RANK
5.0%
UNEMPLOYMENT
95.1/ 100
METRIC RATING
97th/ 347
METRIC RANK
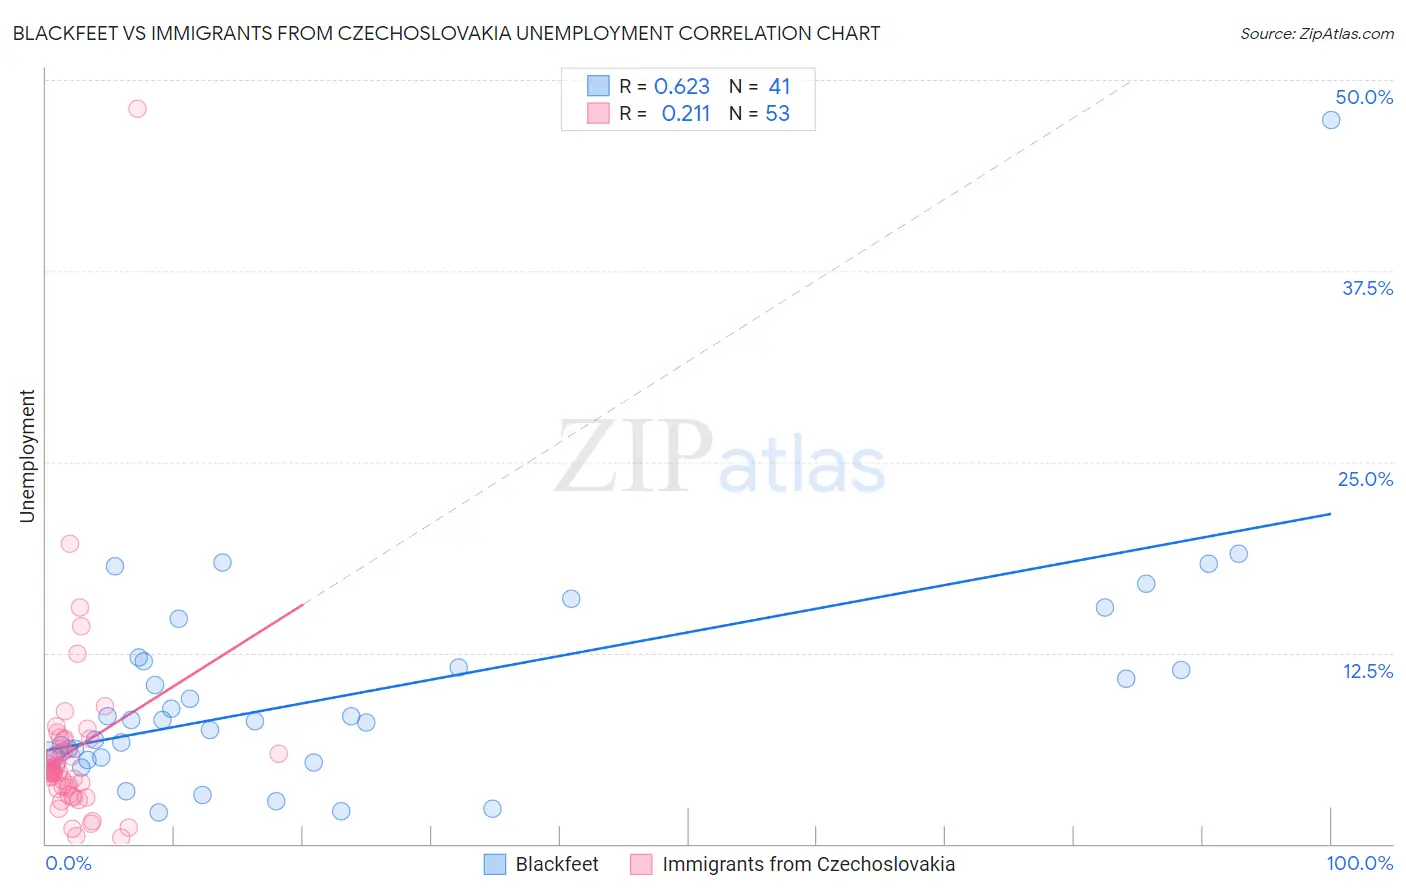
Blackfeet vs Immigrants from Czechoslovakia Unemployment Correlation Chart
The statistical analysis conducted on geographies consisting of 309,227,999 people shows a significant positive correlation between the proportion of Blackfeet and unemployment in the United States with a correlation coefficient (R) of 0.623 and weighted average of 5.8%. Similarly, the statistical analysis conducted on geographies consisting of 195,397,412 people shows a weak positive correlation between the proportion of Immigrants from Czechoslovakia and unemployment in the United States with a correlation coefficient (R) of 0.211 and weighted average of 5.0%, a difference of 16.5%.
Unemployment Correlation Summary
| Measurement | Blackfeet | Immigrants from Czechoslovakia |
| Minimum | 2.0% | 0.40% |
| Maximum | 47.4% | 48.1% |
| Range | 45.4% | 47.7% |
| Mean | 10.0% | 6.2% |
| Median | 8.1% | 4.7% |
| Interquartile 25% (IQ1) | 5.6% | 3.4% |
| Interquartile 75% (IQ3) | 12.1% | 6.9% |
| Interquartile Range (IQR) | 6.5% | 3.5% |
| Standard Deviation (Sample) | 7.7% | 6.9% |
| Standard Deviation (Population) | 7.6% | 6.8% |
Similar Demographics by Unemployment
Demographics Similar to Blackfeet by Unemployment
In terms of unemployment, the demographic groups most similar to Blackfeet are Immigrants from El Salvador (5.8%, a difference of 0.080%), Immigrants from Sierra Leone (5.8%, a difference of 0.090%), Immigrants from Nigeria (5.8%, a difference of 0.13%), Mexican American Indian (5.8%, a difference of 0.20%), and Mexican (5.9%, a difference of 0.23%).
| Demographics | Rating | Rank | Unemployment |
| Salvadorans | 0.1 /100 | #263 | Tragic 5.8% |
| Immigrants | Liberia | 0.1 /100 | #264 | Tragic 5.8% |
| Nigerians | 0.1 /100 | #265 | Tragic 5.8% |
| Mexican American Indians | 0.1 /100 | #266 | Tragic 5.8% |
| Immigrants | Nigeria | 0.1 /100 | #267 | Tragic 5.8% |
| Immigrants | Sierra Leone | 0.1 /100 | #268 | Tragic 5.8% |
| Immigrants | El Salvador | 0.1 /100 | #269 | Tragic 5.8% |
| Blackfeet | 0.1 /100 | #270 | Tragic 5.8% |
| Mexicans | 0.1 /100 | #271 | Tragic 5.9% |
| Hispanics or Latinos | 0.0 /100 | #272 | Tragic 5.9% |
| Immigrants | Fiji | 0.0 /100 | #273 | Tragic 5.9% |
| Bahamians | 0.0 /100 | #274 | Tragic 5.9% |
| Immigrants | Latin America | 0.0 /100 | #275 | Tragic 5.9% |
| Immigrants | Central America | 0.0 /100 | #276 | Tragic 6.0% |
| Armenians | 0.0 /100 | #277 | Tragic 6.0% |
Demographics Similar to Immigrants from Czechoslovakia by Unemployment
In terms of unemployment, the demographic groups most similar to Immigrants from Czechoslovakia are Immigrants from England (5.0%, a difference of 0.030%), Romanian (5.0%, a difference of 0.030%), Mongolian (5.0%, a difference of 0.10%), Estonian (5.0%, a difference of 0.16%), and Immigrants from Serbia (5.0%, a difference of 0.19%).
| Demographics | Rating | Rank | Unemployment |
| Immigrants | North Macedonia | 96.3 /100 | #90 | Exceptional 5.0% |
| Immigrants | Sudan | 96.3 /100 | #91 | Exceptional 5.0% |
| Immigrants | South Africa | 96.2 /100 | #92 | Exceptional 5.0% |
| Ukrainians | 96.0 /100 | #93 | Exceptional 5.0% |
| Immigrants | Austria | 95.9 /100 | #94 | Exceptional 5.0% |
| Immigrants | Serbia | 95.6 /100 | #95 | Exceptional 5.0% |
| Immigrants | England | 95.2 /100 | #96 | Exceptional 5.0% |
| Immigrants | Czechoslovakia | 95.1 /100 | #97 | Exceptional 5.0% |
| Romanians | 95.0 /100 | #98 | Exceptional 5.0% |
| Mongolians | 94.8 /100 | #99 | Exceptional 5.0% |
| Estonians | 94.6 /100 | #100 | Exceptional 5.0% |
| Americans | 94.3 /100 | #101 | Exceptional 5.0% |
| Immigrants | Argentina | 94.1 /100 | #102 | Exceptional 5.0% |
| Chickasaw | 94.0 /100 | #103 | Exceptional 5.0% |
| Osage | 94.0 /100 | #104 | Exceptional 5.0% |