Blackfeet vs Comanche Disability Age 35 to 64
COMPARE
Blackfeet
Comanche
Disability Age 35 to 64
Disability Age 35 to 64 Comparison
Blackfeet
Comanche
14.1%
DISABILITY AGE 35 TO 64
0.0/ 100
METRIC RATING
307th/ 347
METRIC RANK
14.7%
DISABILITY AGE 35 TO 64
0.0/ 100
METRIC RATING
321st/ 347
METRIC RANK
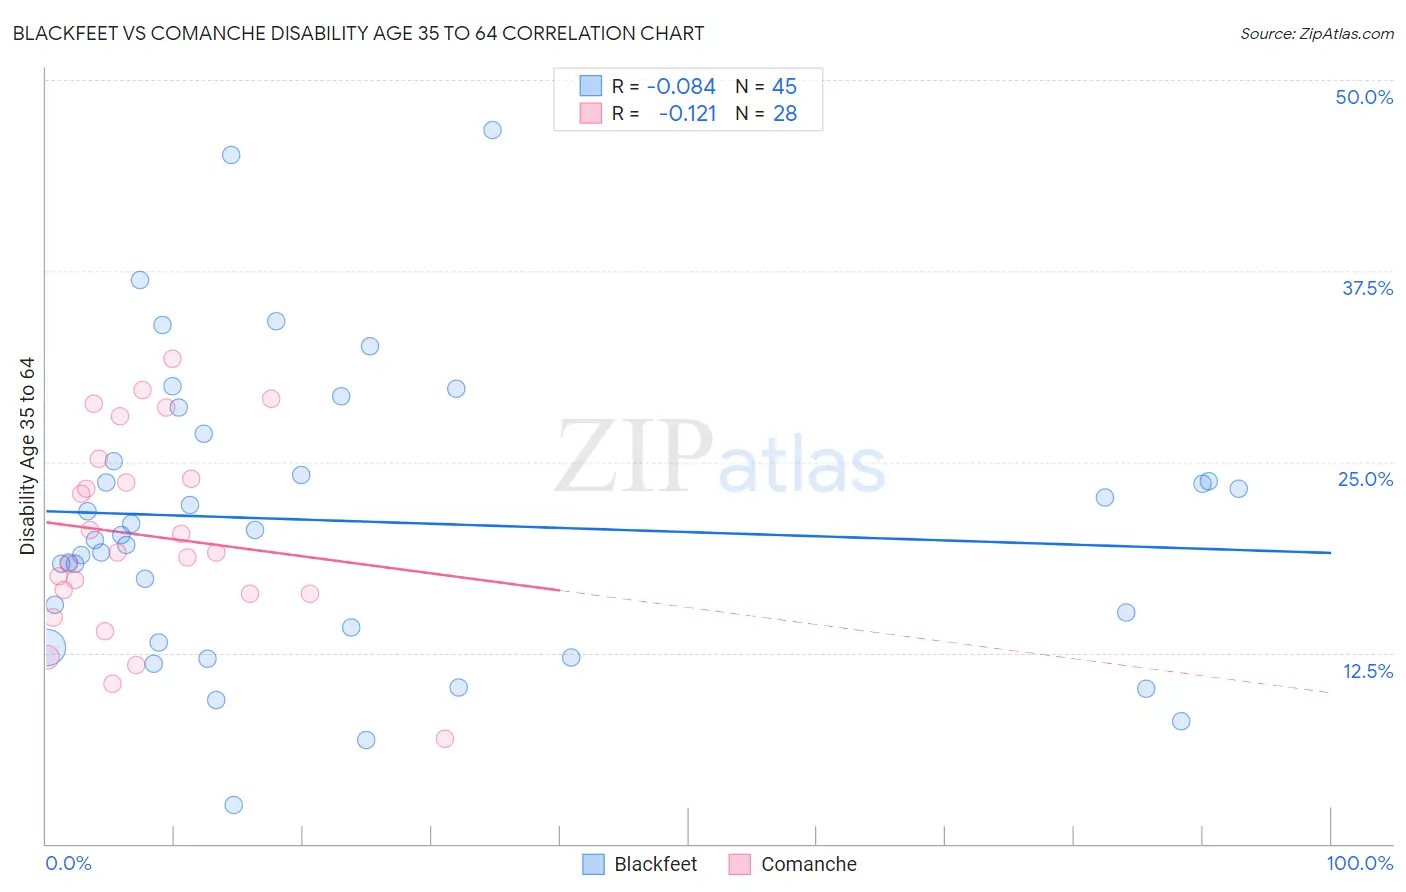
Blackfeet vs Comanche Disability Age 35 to 64 Correlation Chart
The statistical analysis conducted on geographies consisting of 309,440,596 people shows a slight negative correlation between the proportion of Blackfeet and percentage of population with a disability between the ages 34 and 64 in the United States with a correlation coefficient (R) of -0.084 and weighted average of 14.1%. Similarly, the statistical analysis conducted on geographies consisting of 109,769,309 people shows a poor negative correlation between the proportion of Comanche and percentage of population with a disability between the ages 34 and 64 in the United States with a correlation coefficient (R) of -0.121 and weighted average of 14.7%, a difference of 4.9%.
Disability Age 35 to 64 Correlation Summary
| Measurement | Blackfeet | Comanche |
| Minimum | 2.5% | 6.9% |
| Maximum | 46.7% | 31.7% |
| Range | 44.2% | 24.8% |
| Mean | 21.1% | 20.2% |
| Median | 20.2% | 19.1% |
| Interquartile 25% (IQ1) | 13.7% | 16.4% |
| Interquartile 75% (IQ3) | 25.9% | 24.6% |
| Interquartile Range (IQR) | 12.3% | 8.2% |
| Standard Deviation (Sample) | 9.5% | 6.4% |
| Standard Deviation (Population) | 9.4% | 6.3% |
Demographics Similar to Blackfeet and Comanche by Disability Age 35 to 64
In terms of disability age 35 to 64, the demographic groups most similar to Blackfeet are Inupiat (14.1%, a difference of 0.030%), Cree (14.1%, a difference of 0.10%), Immigrants from Yemen (14.0%, a difference of 0.16%), Cape Verdean (14.1%, a difference of 0.57%), and American (13.9%, a difference of 1.0%). Similarly, the demographic groups most similar to Comanche are Potawatomi (14.8%, a difference of 0.040%), Black/African American (14.7%, a difference of 0.26%), Immigrants from Cabo Verde (14.7%, a difference of 0.41%), Ottawa (14.6%, a difference of 0.83%), and Crow (14.6%, a difference of 0.90%).
| Demographics | Rating | Rank | Disability Age 35 to 64 |
| Hopi | 0.0 /100 | #304 | Tragic 13.9% |
| Americans | 0.0 /100 | #305 | Tragic 13.9% |
| Immigrants | Yemen | 0.0 /100 | #306 | Tragic 14.0% |
| Blackfeet | 0.0 /100 | #307 | Tragic 14.1% |
| Inupiat | 0.0 /100 | #308 | Tragic 14.1% |
| Cree | 0.0 /100 | #309 | Tragic 14.1% |
| Cape Verdeans | 0.0 /100 | #310 | Tragic 14.1% |
| Immigrants | Azores | 0.0 /100 | #311 | Tragic 14.3% |
| Paiute | 0.0 /100 | #312 | Tragic 14.3% |
| Iroquois | 0.0 /100 | #313 | Tragic 14.4% |
| Shoshone | 0.0 /100 | #314 | Tragic 14.5% |
| Alaska Natives | 0.0 /100 | #315 | Tragic 14.5% |
| Osage | 0.0 /100 | #316 | Tragic 14.5% |
| Crow | 0.0 /100 | #317 | Tragic 14.6% |
| Ottawa | 0.0 /100 | #318 | Tragic 14.6% |
| Immigrants | Cabo Verde | 0.0 /100 | #319 | Tragic 14.7% |
| Blacks/African Americans | 0.0 /100 | #320 | Tragic 14.7% |
| Comanche | 0.0 /100 | #321 | Tragic 14.7% |
| Potawatomi | 0.0 /100 | #322 | Tragic 14.8% |
| Apache | 0.0 /100 | #323 | Tragic 14.9% |
| Chippewa | 0.0 /100 | #324 | Tragic 15.0% |