Bermudan vs Russian Female Unemployment
COMPARE
Bermudan
Russian
Female Unemployment
Female Unemployment Comparison
Bermudans
Russians
5.4%
FEMALE UNEMPLOYMENT
9.0/ 100
METRIC RATING
218th/ 347
METRIC RANK
5.0%
FEMALE UNEMPLOYMENT
98.0/ 100
METRIC RATING
73rd/ 347
METRIC RANK
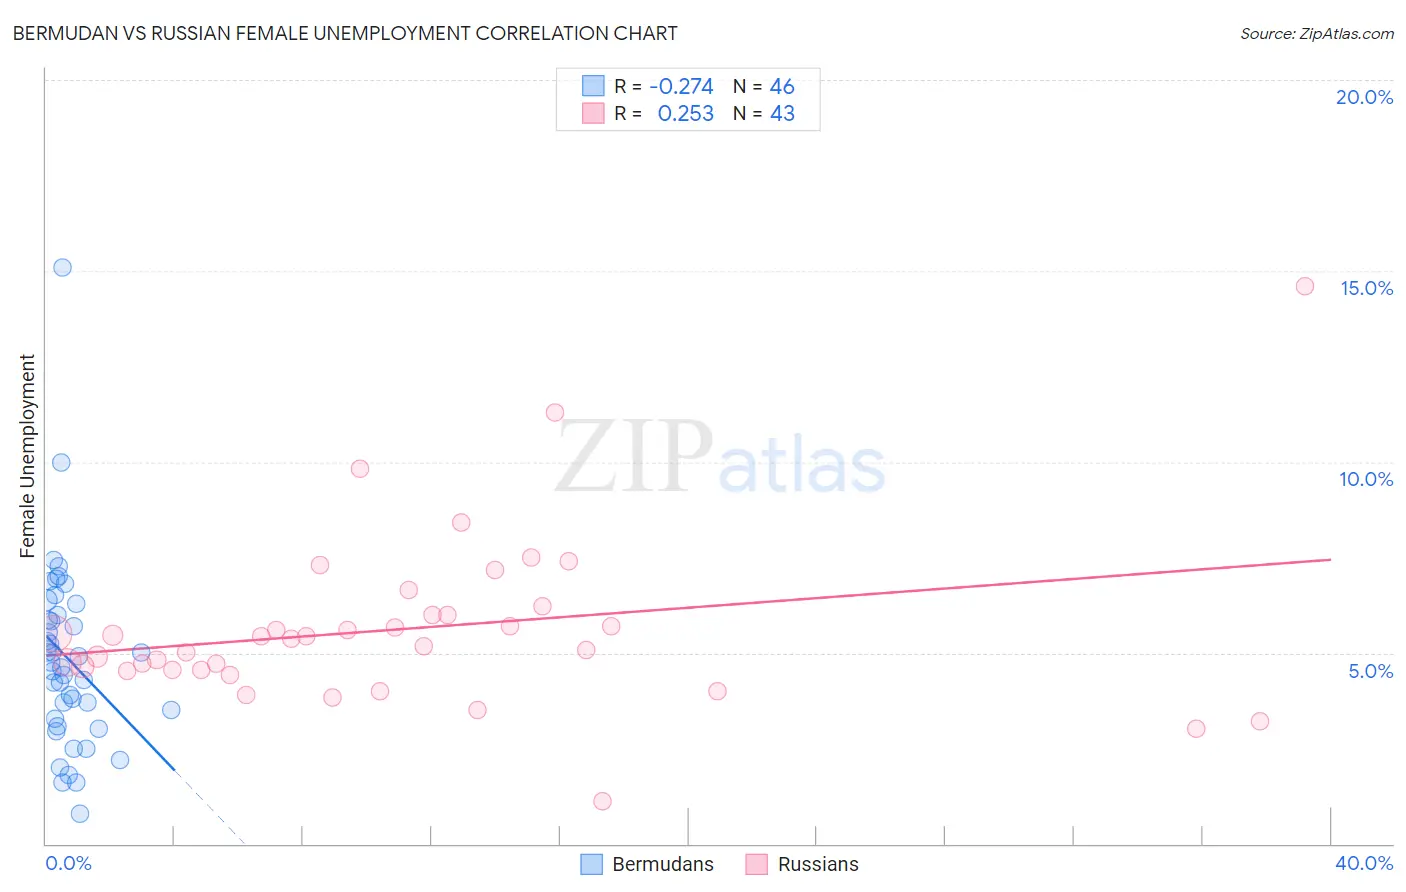
Bermudan vs Russian Female Unemployment Correlation Chart
The statistical analysis conducted on geographies consisting of 55,695,435 people shows a weak negative correlation between the proportion of Bermudans and unemploymnet rate among females in the United States with a correlation coefficient (R) of -0.274 and weighted average of 5.4%. Similarly, the statistical analysis conducted on geographies consisting of 505,214,756 people shows a weak positive correlation between the proportion of Russians and unemploymnet rate among females in the United States with a correlation coefficient (R) of 0.253 and weighted average of 5.0%, a difference of 9.9%.
Female Unemployment Correlation Summary
| Measurement | Bermudan | Russian |
| Minimum | 0.80% | 1.1% |
| Maximum | 15.1% | 14.6% |
| Range | 14.3% | 13.5% |
| Mean | 4.8% | 5.6% |
| Median | 4.7% | 5.4% |
| Interquartile 25% (IQ1) | 3.3% | 4.5% |
| Interquartile 75% (IQ3) | 6.0% | 6.0% |
| Interquartile Range (IQR) | 2.7% | 1.5% |
| Standard Deviation (Sample) | 2.4% | 2.2% |
| Standard Deviation (Population) | 2.4% | 2.2% |
Similar Demographics by Female Unemployment
Demographics Similar to Bermudans by Female Unemployment
In terms of female unemployment, the demographic groups most similar to Bermudans are South American (5.4%, a difference of 0.070%), Immigrants from Africa (5.4%, a difference of 0.090%), Peruvian (5.4%, a difference of 0.10%), Comanche (5.4%, a difference of 0.17%), and Immigrants from Nicaragua (5.4%, a difference of 0.19%).
| Demographics | Rating | Rank | Female Unemployment |
| Ottawa | 11.6 /100 | #211 | Poor 5.4% |
| Uruguayans | 11.4 /100 | #212 | Poor 5.4% |
| Samoans | 10.6 /100 | #213 | Poor 5.4% |
| Seminole | 10.3 /100 | #214 | Poor 5.4% |
| Immigrants | Nicaragua | 10.2 /100 | #215 | Poor 5.4% |
| Comanche | 10.0 /100 | #216 | Poor 5.4% |
| Peruvians | 9.6 /100 | #217 | Tragic 5.4% |
| Bermudans | 9.0 /100 | #218 | Tragic 5.4% |
| South Americans | 8.6 /100 | #219 | Tragic 5.4% |
| Immigrants | Africa | 8.5 /100 | #220 | Tragic 5.4% |
| Brazilians | 7.3 /100 | #221 | Tragic 5.5% |
| Nicaraguans | 7.2 /100 | #222 | Tragic 5.5% |
| Delaware | 7.2 /100 | #223 | Tragic 5.5% |
| Iraqis | 7.1 /100 | #224 | Tragic 5.5% |
| French American Indians | 6.1 /100 | #225 | Tragic 5.5% |
Demographics Similar to Russians by Female Unemployment
In terms of female unemployment, the demographic groups most similar to Russians are Immigrants from Bolivia (5.0%, a difference of 0.010%), Immigrants from Northern Europe (4.9%, a difference of 0.030%), Immigrants from Singapore (5.0%, a difference of 0.030%), Immigrants from Venezuela (5.0%, a difference of 0.040%), and German Russian (4.9%, a difference of 0.10%).
| Demographics | Rating | Rank | Female Unemployment |
| Hungarians | 98.3 /100 | #66 | Exceptional 4.9% |
| Cubans | 98.3 /100 | #67 | Exceptional 4.9% |
| Tlingit-Haida | 98.3 /100 | #68 | Exceptional 4.9% |
| Immigrants | Ireland | 98.2 /100 | #69 | Exceptional 4.9% |
| Osage | 98.2 /100 | #70 | Exceptional 4.9% |
| German Russians | 98.1 /100 | #71 | Exceptional 4.9% |
| Immigrants | Northern Europe | 98.0 /100 | #72 | Exceptional 4.9% |
| Russians | 98.0 /100 | #73 | Exceptional 5.0% |
| Immigrants | Bolivia | 98.0 /100 | #74 | Exceptional 5.0% |
| Immigrants | Singapore | 98.0 /100 | #75 | Exceptional 5.0% |
| Immigrants | Venezuela | 97.9 /100 | #76 | Exceptional 5.0% |
| Mongolians | 97.8 /100 | #77 | Exceptional 5.0% |
| Immigrants | Netherlands | 97.8 /100 | #78 | Exceptional 5.0% |
| Turks | 97.6 /100 | #79 | Exceptional 5.0% |
| New Zealanders | 97.4 /100 | #80 | Exceptional 5.0% |