Bermudan vs Slovene Female Unemployment
COMPARE
Bermudan
Slovene
Female Unemployment
Female Unemployment Comparison
Bermudans
Slovenes
5.4%
FEMALE UNEMPLOYMENT
9.0/ 100
METRIC RATING
218th/ 347
METRIC RANK
4.5%
FEMALE UNEMPLOYMENT
100.0/ 100
METRIC RATING
9th/ 347
METRIC RANK
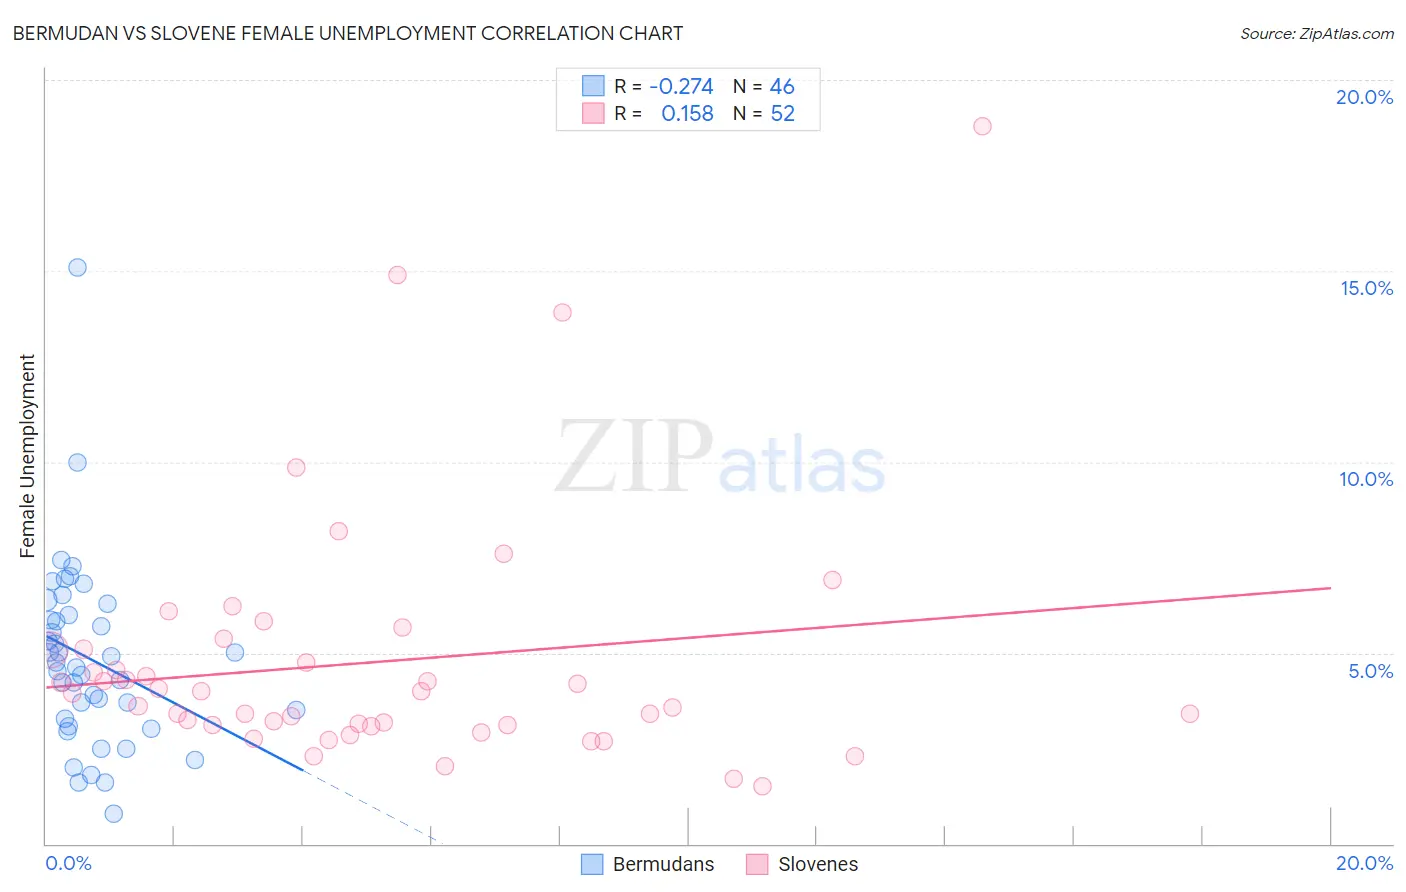
Bermudan vs Slovene Female Unemployment Correlation Chart
The statistical analysis conducted on geographies consisting of 55,695,435 people shows a weak negative correlation between the proportion of Bermudans and unemploymnet rate among females in the United States with a correlation coefficient (R) of -0.274 and weighted average of 5.4%. Similarly, the statistical analysis conducted on geographies consisting of 260,209,646 people shows a poor positive correlation between the proportion of Slovenes and unemploymnet rate among females in the United States with a correlation coefficient (R) of 0.158 and weighted average of 4.5%, a difference of 20.9%.
Female Unemployment Correlation Summary
| Measurement | Bermudan | Slovene |
| Minimum | 0.80% | 1.5% |
| Maximum | 15.1% | 18.8% |
| Range | 14.3% | 17.3% |
| Mean | 4.8% | 4.8% |
| Median | 4.7% | 4.0% |
| Interquartile 25% (IQ1) | 3.3% | 3.1% |
| Interquartile 75% (IQ3) | 6.0% | 5.1% |
| Interquartile Range (IQR) | 2.7% | 2.0% |
| Standard Deviation (Sample) | 2.4% | 3.2% |
| Standard Deviation (Population) | 2.4% | 3.2% |
Similar Demographics by Female Unemployment
Demographics Similar to Bermudans by Female Unemployment
In terms of female unemployment, the demographic groups most similar to Bermudans are South American (5.4%, a difference of 0.070%), Immigrants from Africa (5.4%, a difference of 0.090%), Peruvian (5.4%, a difference of 0.10%), Comanche (5.4%, a difference of 0.17%), and Immigrants from Nicaragua (5.4%, a difference of 0.19%).
| Demographics | Rating | Rank | Female Unemployment |
| Ottawa | 11.6 /100 | #211 | Poor 5.4% |
| Uruguayans | 11.4 /100 | #212 | Poor 5.4% |
| Samoans | 10.6 /100 | #213 | Poor 5.4% |
| Seminole | 10.3 /100 | #214 | Poor 5.4% |
| Immigrants | Nicaragua | 10.2 /100 | #215 | Poor 5.4% |
| Comanche | 10.0 /100 | #216 | Poor 5.4% |
| Peruvians | 9.6 /100 | #217 | Tragic 5.4% |
| Bermudans | 9.0 /100 | #218 | Tragic 5.4% |
| South Americans | 8.6 /100 | #219 | Tragic 5.4% |
| Immigrants | Africa | 8.5 /100 | #220 | Tragic 5.4% |
| Brazilians | 7.3 /100 | #221 | Tragic 5.5% |
| Nicaraguans | 7.2 /100 | #222 | Tragic 5.5% |
| Delaware | 7.2 /100 | #223 | Tragic 5.5% |
| Iraqis | 7.1 /100 | #224 | Tragic 5.5% |
| French American Indians | 6.1 /100 | #225 | Tragic 5.5% |
Demographics Similar to Slovenes by Female Unemployment
In terms of female unemployment, the demographic groups most similar to Slovenes are German (4.5%, a difference of 0.36%), Chinese (4.5%, a difference of 0.38%), Swedish (4.4%, a difference of 1.1%), Swiss (4.6%, a difference of 1.3%), and Scandinavian (4.6%, a difference of 1.4%).
| Demographics | Rating | Rank | Female Unemployment |
| Czechs | 100.0 /100 | #2 | Exceptional 4.4% |
| Luxembourgers | 100.0 /100 | #3 | Exceptional 4.4% |
| Danes | 100.0 /100 | #4 | Exceptional 4.4% |
| Hmong | 100.0 /100 | #5 | Exceptional 4.4% |
| Swedes | 100.0 /100 | #6 | Exceptional 4.4% |
| Chinese | 100.0 /100 | #7 | Exceptional 4.5% |
| Germans | 100.0 /100 | #8 | Exceptional 4.5% |
| Slovenes | 100.0 /100 | #9 | Exceptional 4.5% |
| Swiss | 100.0 /100 | #10 | Exceptional 4.6% |
| Scandinavians | 100.0 /100 | #11 | Exceptional 4.6% |
| Dutch | 100.0 /100 | #12 | Exceptional 4.6% |
| Belgians | 100.0 /100 | #13 | Exceptional 4.6% |
| Finns | 100.0 /100 | #14 | Exceptional 4.6% |
| English | 100.0 /100 | #15 | Exceptional 4.6% |
| Carpatho Rusyns | 99.9 /100 | #16 | Exceptional 4.7% |