Belgian vs Paraguayan Unemployment
COMPARE
Belgian
Paraguayan
Unemployment
Unemployment Comparison
Belgians
Paraguayans
4.6%
UNEMPLOYMENT
100.0/ 100
METRIC RATING
13th/ 347
METRIC RANK
4.9%
UNEMPLOYMENT
98.3/ 100
METRIC RATING
73rd/ 347
METRIC RANK
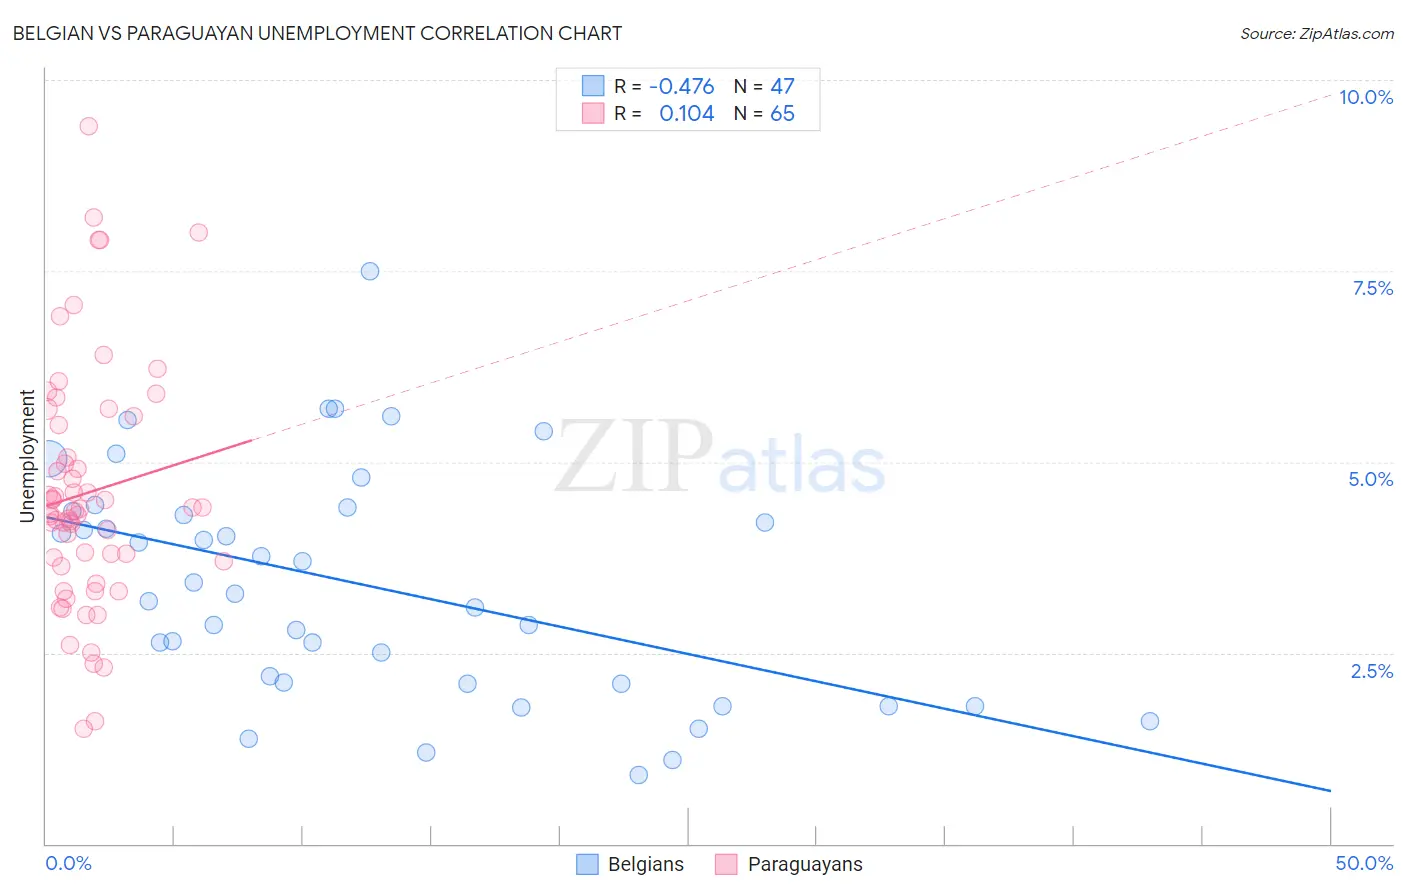
Belgian vs Paraguayan Unemployment Correlation Chart
The statistical analysis conducted on geographies consisting of 355,448,052 people shows a moderate negative correlation between the proportion of Belgians and unemployment in the United States with a correlation coefficient (R) of -0.476 and weighted average of 4.6%. Similarly, the statistical analysis conducted on geographies consisting of 95,099,776 people shows a poor positive correlation between the proportion of Paraguayans and unemployment in the United States with a correlation coefficient (R) of 0.104 and weighted average of 4.9%, a difference of 6.9%.
Unemployment Correlation Summary
| Measurement | Belgian | Paraguayan |
| Minimum | 0.90% | 1.5% |
| Maximum | 7.5% | 9.4% |
| Range | 6.6% | 7.9% |
| Mean | 3.4% | 4.6% |
| Median | 3.3% | 4.4% |
| Interquartile 25% (IQ1) | 2.1% | 3.7% |
| Interquartile 75% (IQ3) | 4.4% | 5.5% |
| Interquartile Range (IQR) | 2.3% | 1.9% |
| Standard Deviation (Sample) | 1.5% | 1.6% |
| Standard Deviation (Population) | 1.5% | 1.6% |
Similar Demographics by Unemployment
Demographics Similar to Belgians by Unemployment
In terms of unemployment, the demographic groups most similar to Belgians are Pennsylvania German (4.6%, a difference of 0.16%), Immigrants from Cuba (4.6%, a difference of 0.24%), English (4.6%, a difference of 0.26%), European (4.6%, a difference of 0.72%), and Chinese (4.7%, a difference of 0.86%).
| Demographics | Rating | Rank | Unemployment |
| Germans | 100.0 /100 | #6 | Exceptional 4.5% |
| Immigrants | India | 100.0 /100 | #7 | Exceptional 4.5% |
| Swiss | 100.0 /100 | #8 | Exceptional 4.5% |
| Scandinavians | 100.0 /100 | #9 | Exceptional 4.5% |
| Dutch | 100.0 /100 | #10 | Exceptional 4.6% |
| English | 100.0 /100 | #11 | Exceptional 4.6% |
| Pennsylvania Germans | 100.0 /100 | #12 | Exceptional 4.6% |
| Belgians | 100.0 /100 | #13 | Exceptional 4.6% |
| Immigrants | Cuba | 100.0 /100 | #14 | Exceptional 4.6% |
| Europeans | 99.9 /100 | #15 | Exceptional 4.6% |
| Chinese | 99.9 /100 | #16 | Exceptional 4.7% |
| Slovenes | 99.9 /100 | #17 | Exceptional 4.7% |
| Immigrants | Venezuela | 99.9 /100 | #18 | Exceptional 4.7% |
| Scottish | 99.9 /100 | #19 | Exceptional 4.7% |
| Carpatho Rusyns | 99.9 /100 | #20 | Exceptional 4.7% |
Demographics Similar to Paraguayans by Unemployment
In terms of unemployment, the demographic groups most similar to Paraguayans are Burmese (4.9%, a difference of 0.040%), Immigrants from Japan (4.9%, a difference of 0.070%), Immigrants from Northern Europe (4.9%, a difference of 0.090%), Serbian (4.9%, a difference of 0.12%), and Turkish (4.9%, a difference of 0.23%).
| Demographics | Rating | Rank | Unemployment |
| Slovaks | 98.7 /100 | #66 | Exceptional 4.9% |
| New Zealanders | 98.6 /100 | #67 | Exceptional 4.9% |
| Slavs | 98.6 /100 | #68 | Exceptional 4.9% |
| Immigrants | North America | 98.5 /100 | #69 | Exceptional 4.9% |
| Serbians | 98.4 /100 | #70 | Exceptional 4.9% |
| Immigrants | Japan | 98.3 /100 | #71 | Exceptional 4.9% |
| Burmese | 98.3 /100 | #72 | Exceptional 4.9% |
| Paraguayans | 98.3 /100 | #73 | Exceptional 4.9% |
| Immigrants | Northern Europe | 98.2 /100 | #74 | Exceptional 4.9% |
| Turks | 98.0 /100 | #75 | Exceptional 4.9% |
| German Russians | 98.0 /100 | #76 | Exceptional 4.9% |
| Cypriots | 97.9 /100 | #77 | Exceptional 4.9% |
| Okinawans | 97.9 /100 | #78 | Exceptional 4.9% |
| Canadians | 97.7 /100 | #79 | Exceptional 5.0% |
| Immigrants | Sweden | 97.6 /100 | #80 | Exceptional 5.0% |