Basque vs Dutch West Indian Female Unemployment
COMPARE
Basque
Dutch West Indian
Female Unemployment
Female Unemployment Comparison
Basques
Dutch West Indians
5.1%
FEMALE UNEMPLOYMENT
86.5/ 100
METRIC RATING
125th/ 347
METRIC RANK
5.7%
FEMALE UNEMPLOYMENT
0.3/ 100
METRIC RATING
257th/ 347
METRIC RANK
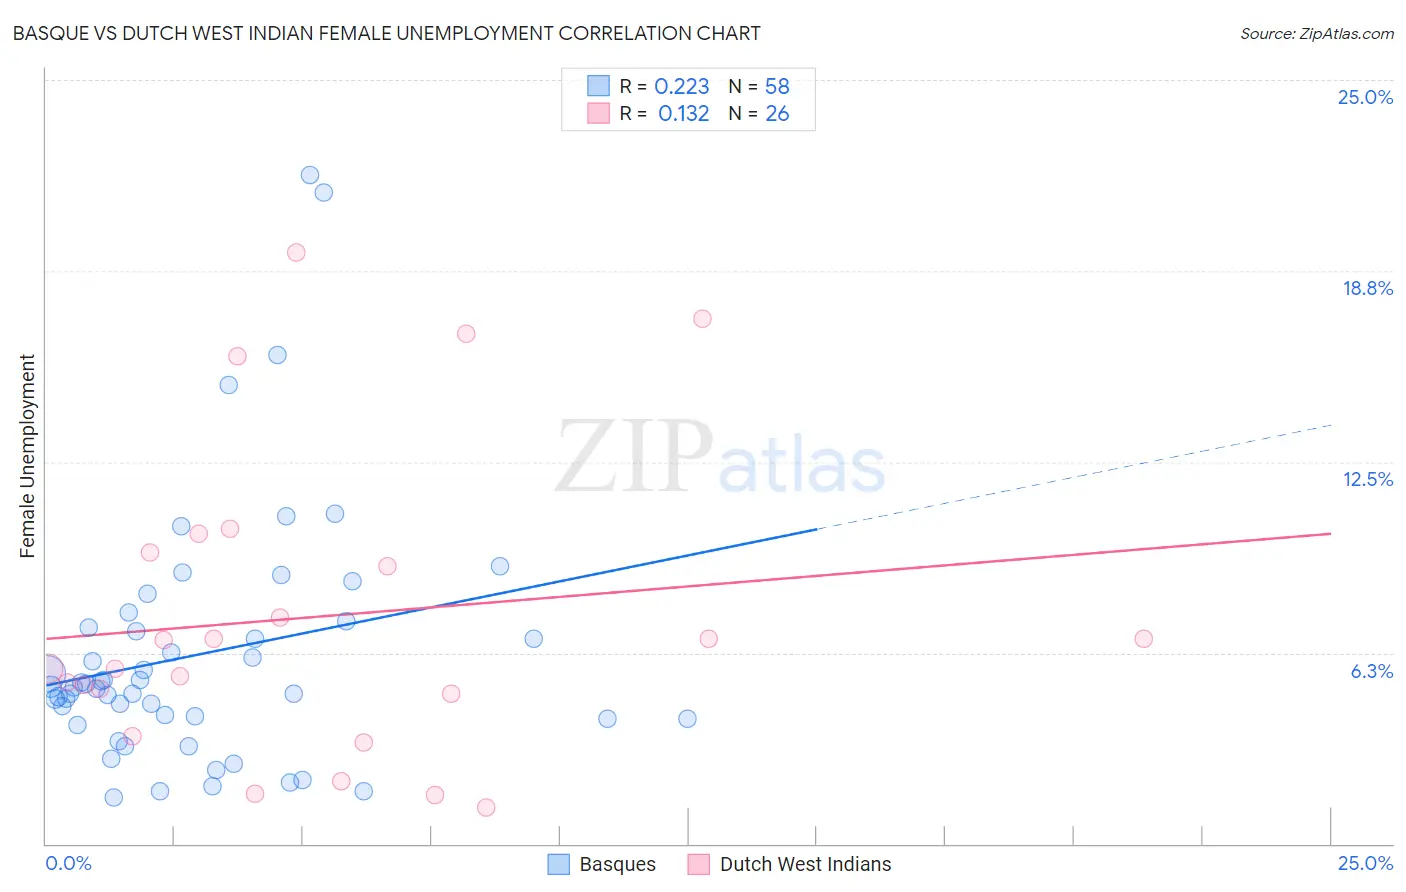
Basque vs Dutch West Indian Female Unemployment Correlation Chart
The statistical analysis conducted on geographies consisting of 165,405,269 people shows a weak positive correlation between the proportion of Basques and unemploymnet rate among females in the United States with a correlation coefficient (R) of 0.223 and weighted average of 5.1%. Similarly, the statistical analysis conducted on geographies consisting of 85,478,446 people shows a poor positive correlation between the proportion of Dutch West Indians and unemploymnet rate among females in the United States with a correlation coefficient (R) of 0.132 and weighted average of 5.7%, a difference of 11.6%.
Female Unemployment Correlation Summary
| Measurement | Basque | Dutch West Indian |
| Minimum | 1.5% | 1.2% |
| Maximum | 21.9% | 19.3% |
| Range | 20.4% | 18.1% |
| Mean | 6.2% | 7.4% |
| Median | 5.1% | 6.2% |
| Interquartile 25% (IQ1) | 4.1% | 4.9% |
| Interquartile 75% (IQ3) | 7.1% | 9.5% |
| Interquartile Range (IQR) | 3.0% | 4.6% |
| Standard Deviation (Sample) | 4.1% | 5.0% |
| Standard Deviation (Population) | 4.1% | 4.9% |
Similar Demographics by Female Unemployment
Demographics Similar to Basques by Female Unemployment
In terms of female unemployment, the demographic groups most similar to Basques are Immigrants from Korea (5.1%, a difference of 0.020%), Immigrants from Hungary (5.1%, a difference of 0.060%), Chilean (5.1%, a difference of 0.090%), Immigrants from Europe (5.1%, a difference of 0.10%), and Ethiopian (5.1%, a difference of 0.10%).
| Demographics | Rating | Rank | Female Unemployment |
| Immigrants | Croatia | 89.9 /100 | #118 | Excellent 5.1% |
| Immigrants | North Macedonia | 88.3 /100 | #119 | Excellent 5.1% |
| Immigrants | Romania | 88.1 /100 | #120 | Excellent 5.1% |
| Immigrants | Western Europe | 88.1 /100 | #121 | Excellent 5.1% |
| Immigrants | Germany | 87.6 /100 | #122 | Excellent 5.1% |
| Immigrants | South Africa | 87.6 /100 | #123 | Excellent 5.1% |
| Immigrants | Europe | 87.2 /100 | #124 | Excellent 5.1% |
| Basques | 86.5 /100 | #125 | Excellent 5.1% |
| Immigrants | Korea | 86.3 /100 | #126 | Excellent 5.1% |
| Immigrants | Hungary | 86.0 /100 | #127 | Excellent 5.1% |
| Chileans | 85.8 /100 | #128 | Excellent 5.1% |
| Ethiopians | 85.7 /100 | #129 | Excellent 5.1% |
| Maltese | 85.5 /100 | #130 | Excellent 5.1% |
| Immigrants | Ethiopia | 85.4 /100 | #131 | Excellent 5.1% |
| Immigrants | Sri Lanka | 85.0 /100 | #132 | Excellent 5.1% |
Demographics Similar to Dutch West Indians by Female Unemployment
In terms of female unemployment, the demographic groups most similar to Dutch West Indians are Subsaharan African (5.7%, a difference of 0.070%), Immigrants from Cameroon (5.7%, a difference of 0.74%), Immigrants from Sierra Leone (5.7%, a difference of 0.78%), Immigrants (5.7%, a difference of 0.78%), and Immigrants from Portugal (5.8%, a difference of 0.81%).
| Demographics | Rating | Rank | Female Unemployment |
| Immigrants | Syria | 0.8 /100 | #250 | Tragic 5.6% |
| Assyrians/Chaldeans/Syriacs | 0.8 /100 | #251 | Tragic 5.6% |
| Cajuns | 0.7 /100 | #252 | Tragic 5.7% |
| Immigrants | Sierra Leone | 0.6 /100 | #253 | Tragic 5.7% |
| Immigrants | Immigrants | 0.6 /100 | #254 | Tragic 5.7% |
| Immigrants | Cameroon | 0.6 /100 | #255 | Tragic 5.7% |
| Sub-Saharan Africans | 0.4 /100 | #256 | Tragic 5.7% |
| Dutch West Indians | 0.3 /100 | #257 | Tragic 5.7% |
| Immigrants | Portugal | 0.2 /100 | #258 | Tragic 5.8% |
| Immigrants | Fiji | 0.2 /100 | #259 | Tragic 5.8% |
| Nigerians | 0.2 /100 | #260 | Tragic 5.8% |
| Kiowa | 0.1 /100 | #261 | Tragic 5.8% |
| Immigrants | Nigeria | 0.1 /100 | #262 | Tragic 5.8% |
| Immigrants | Azores | 0.1 /100 | #263 | Tragic 5.8% |
| Immigrants | Bahamas | 0.1 /100 | #264 | Tragic 5.8% |