Basque vs Immigrants from China Female Unemployment
COMPARE
Basque
Immigrants from China
Female Unemployment
Female Unemployment Comparison
Basques
Immigrants from China
5.1%
FEMALE UNEMPLOYMENT
86.5/ 100
METRIC RATING
125th/ 347
METRIC RANK
5.2%
FEMALE UNEMPLOYMENT
75.9/ 100
METRIC RATING
151st/ 347
METRIC RANK
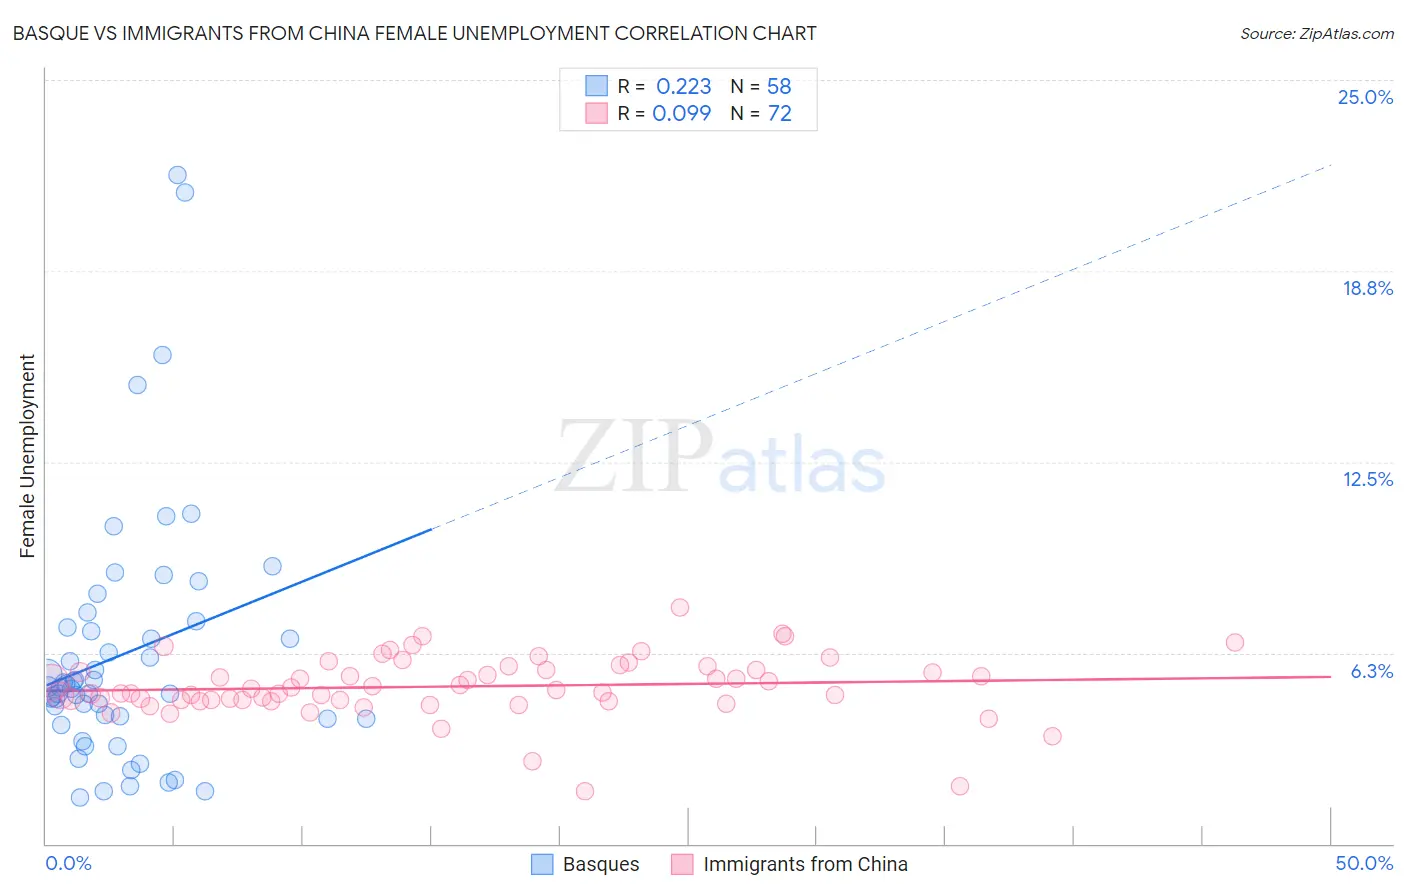
Basque vs Immigrants from China Female Unemployment Correlation Chart
The statistical analysis conducted on geographies consisting of 165,405,269 people shows a weak positive correlation between the proportion of Basques and unemploymnet rate among females in the United States with a correlation coefficient (R) of 0.223 and weighted average of 5.1%. Similarly, the statistical analysis conducted on geographies consisting of 454,254,097 people shows a slight positive correlation between the proportion of Immigrants from China and unemploymnet rate among females in the United States with a correlation coefficient (R) of 0.099 and weighted average of 5.2%, a difference of 1.1%.
Female Unemployment Correlation Summary
| Measurement | Basque | Immigrants from China |
| Minimum | 1.5% | 1.7% |
| Maximum | 21.9% | 7.7% |
| Range | 20.4% | 6.0% |
| Mean | 6.2% | 5.1% |
| Median | 5.1% | 5.1% |
| Interquartile 25% (IQ1) | 4.1% | 4.7% |
| Interquartile 75% (IQ3) | 7.1% | 5.8% |
| Interquartile Range (IQR) | 3.0% | 1.0% |
| Standard Deviation (Sample) | 4.1% | 1.0% |
| Standard Deviation (Population) | 4.1% | 1.0% |
Similar Demographics by Female Unemployment
Demographics Similar to Basques by Female Unemployment
In terms of female unemployment, the demographic groups most similar to Basques are Immigrants from Korea (5.1%, a difference of 0.020%), Immigrants from Hungary (5.1%, a difference of 0.060%), Chilean (5.1%, a difference of 0.090%), Immigrants from Europe (5.1%, a difference of 0.10%), and Ethiopian (5.1%, a difference of 0.10%).
| Demographics | Rating | Rank | Female Unemployment |
| Immigrants | Croatia | 89.9 /100 | #118 | Excellent 5.1% |
| Immigrants | North Macedonia | 88.3 /100 | #119 | Excellent 5.1% |
| Immigrants | Romania | 88.1 /100 | #120 | Excellent 5.1% |
| Immigrants | Western Europe | 88.1 /100 | #121 | Excellent 5.1% |
| Immigrants | Germany | 87.6 /100 | #122 | Excellent 5.1% |
| Immigrants | South Africa | 87.6 /100 | #123 | Excellent 5.1% |
| Immigrants | Europe | 87.2 /100 | #124 | Excellent 5.1% |
| Basques | 86.5 /100 | #125 | Excellent 5.1% |
| Immigrants | Korea | 86.3 /100 | #126 | Excellent 5.1% |
| Immigrants | Hungary | 86.0 /100 | #127 | Excellent 5.1% |
| Chileans | 85.8 /100 | #128 | Excellent 5.1% |
| Ethiopians | 85.7 /100 | #129 | Excellent 5.1% |
| Maltese | 85.5 /100 | #130 | Excellent 5.1% |
| Immigrants | Ethiopia | 85.4 /100 | #131 | Excellent 5.1% |
| Immigrants | Sri Lanka | 85.0 /100 | #132 | Excellent 5.1% |
Demographics Similar to Immigrants from China by Female Unemployment
In terms of female unemployment, the demographic groups most similar to Immigrants from China are Immigrants from Italy (5.2%, a difference of 0.080%), Immigrants from Greece (5.2%, a difference of 0.080%), Asian (5.2%, a difference of 0.21%), Egyptian (5.2%, a difference of 0.21%), and Immigrants from Argentina (5.2%, a difference of 0.24%).
| Demographics | Rating | Rank | Female Unemployment |
| Immigrants | Jordan | 80.4 /100 | #144 | Excellent 5.1% |
| Immigrants | Oceania | 79.5 /100 | #145 | Good 5.2% |
| Immigrants | Norway | 79.4 /100 | #146 | Good 5.2% |
| Argentineans | 79.2 /100 | #147 | Good 5.2% |
| Immigrants | Argentina | 78.7 /100 | #148 | Good 5.2% |
| Asians | 78.3 /100 | #149 | Good 5.2% |
| Egyptians | 78.3 /100 | #150 | Good 5.2% |
| Immigrants | China | 75.9 /100 | #151 | Good 5.2% |
| Immigrants | Italy | 75.0 /100 | #152 | Good 5.2% |
| Immigrants | Greece | 74.9 /100 | #153 | Good 5.2% |
| South Africans | 70.8 /100 | #154 | Good 5.2% |
| Immigrants | Egypt | 70.0 /100 | #155 | Good 5.2% |
| Immigrants | Northern Africa | 69.6 /100 | #156 | Good 5.2% |
| Immigrants | Russia | 69.3 /100 | #157 | Good 5.2% |
| Albanians | 68.3 /100 | #158 | Good 5.2% |