Barbadian vs Immigrants from Australia Female Unemployment
COMPARE
Barbadian
Immigrants from Australia
Female Unemployment
Female Unemployment Comparison
Barbadians
Immigrants from Australia
6.2%
FEMALE UNEMPLOYMENT
0.0/ 100
METRIC RATING
303rd/ 347
METRIC RANK
5.0%
FEMALE UNEMPLOYMENT
97.3/ 100
METRIC RATING
82nd/ 347
METRIC RANK
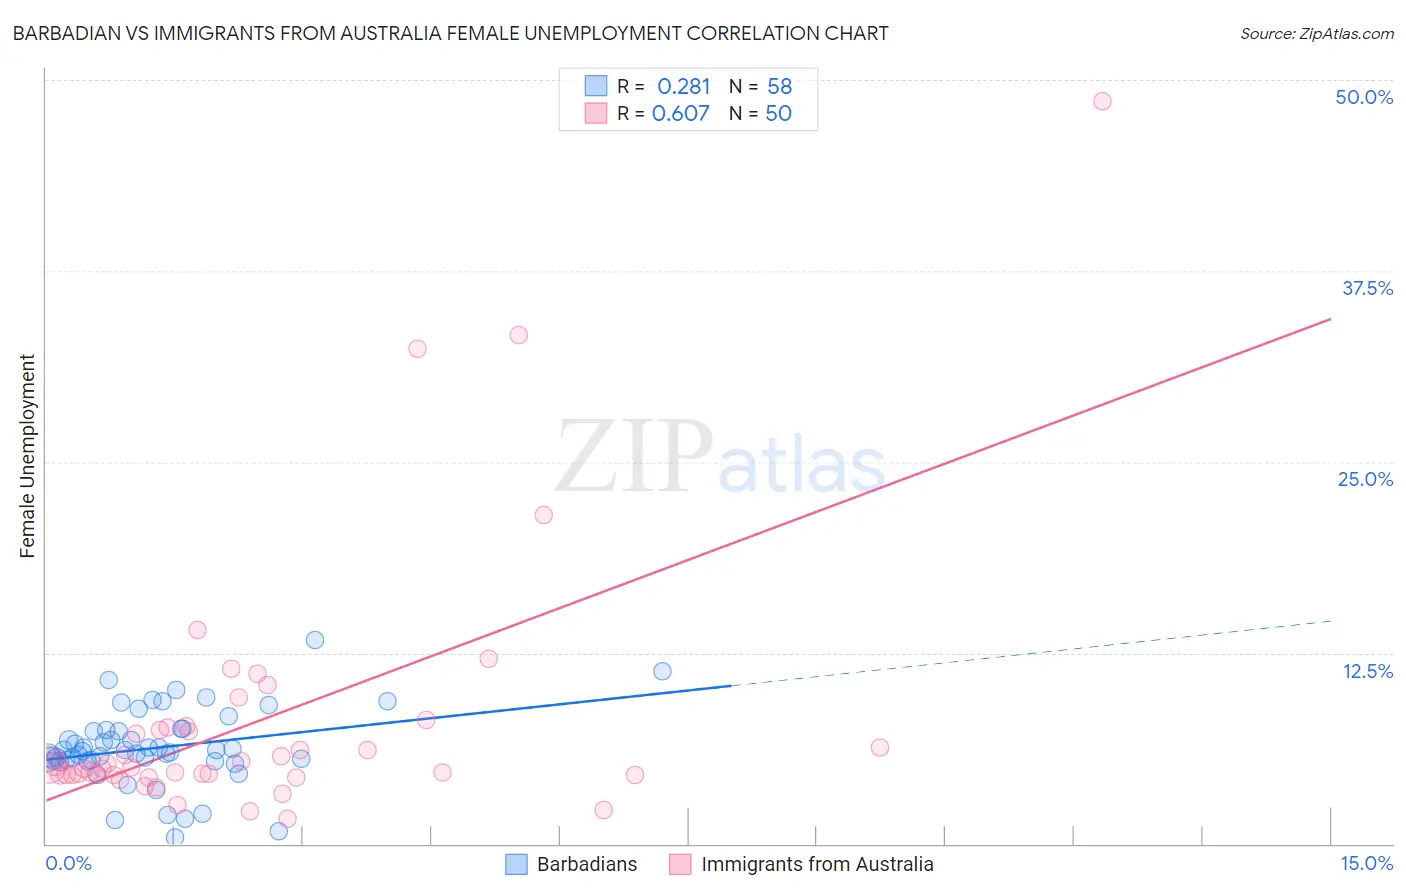
Barbadian vs Immigrants from Australia Female Unemployment Correlation Chart
The statistical analysis conducted on geographies consisting of 141,186,778 people shows a weak positive correlation between the proportion of Barbadians and unemploymnet rate among females in the United States with a correlation coefficient (R) of 0.281 and weighted average of 6.2%. Similarly, the statistical analysis conducted on geographies consisting of 226,659,190 people shows a significant positive correlation between the proportion of Immigrants from Australia and unemploymnet rate among females in the United States with a correlation coefficient (R) of 0.607 and weighted average of 5.0%, a difference of 24.4%.
Female Unemployment Correlation Summary
| Measurement | Barbadian | Immigrants from Australia |
| Minimum | 0.40% | 1.6% |
| Maximum | 13.3% | 48.6% |
| Range | 12.9% | 47.0% |
| Mean | 6.3% | 8.1% |
| Median | 6.1% | 5.1% |
| Interquartile 25% (IQ1) | 5.4% | 4.5% |
| Interquartile 75% (IQ3) | 7.5% | 7.6% |
| Interquartile Range (IQR) | 2.0% | 3.1% |
| Standard Deviation (Sample) | 2.5% | 8.6% |
| Standard Deviation (Population) | 2.5% | 8.5% |
Similar Demographics by Female Unemployment
Demographics Similar to Barbadians by Female Unemployment
In terms of female unemployment, the demographic groups most similar to Barbadians are U.S. Virgin Islander (6.2%, a difference of 0.34%), Immigrants from Jamaica (6.2%, a difference of 0.37%), Spanish American Indian (6.2%, a difference of 0.42%), Immigrants from Barbados (6.2%, a difference of 0.50%), and Immigrants from Central America (6.2%, a difference of 0.58%).
| Demographics | Rating | Rank | Female Unemployment |
| Alaskan Athabascans | 0.0 /100 | #296 | Tragic 6.1% |
| West Indians | 0.0 /100 | #297 | Tragic 6.1% |
| Jamaicans | 0.0 /100 | #298 | Tragic 6.1% |
| Ute | 0.0 /100 | #299 | Tragic 6.1% |
| Immigrants | Haiti | 0.0 /100 | #300 | Tragic 6.1% |
| Immigrants | Barbados | 0.0 /100 | #301 | Tragic 6.2% |
| U.S. Virgin Islanders | 0.0 /100 | #302 | Tragic 6.2% |
| Barbadians | 0.0 /100 | #303 | Tragic 6.2% |
| Immigrants | Jamaica | 0.0 /100 | #304 | Tragic 6.2% |
| Spanish American Indians | 0.0 /100 | #305 | Tragic 6.2% |
| Immigrants | Central America | 0.0 /100 | #306 | Tragic 6.2% |
| Shoshone | 0.0 /100 | #307 | Tragic 6.2% |
| Hispanics or Latinos | 0.0 /100 | #308 | Tragic 6.2% |
| Ecuadorians | 0.0 /100 | #309 | Tragic 6.3% |
| Central American Indians | 0.0 /100 | #310 | Tragic 6.3% |
Demographics Similar to Immigrants from Australia by Female Unemployment
In terms of female unemployment, the demographic groups most similar to Immigrants from Australia are Immigrants from Serbia (5.0%, a difference of 0.020%), Filipino (5.0%, a difference of 0.050%), Canadian (5.0%, a difference of 0.050%), New Zealander (5.0%, a difference of 0.070%), and Ukrainian (5.0%, a difference of 0.090%).
| Demographics | Rating | Rank | Female Unemployment |
| Immigrants | Singapore | 98.0 /100 | #75 | Exceptional 5.0% |
| Immigrants | Venezuela | 97.9 /100 | #76 | Exceptional 5.0% |
| Mongolians | 97.8 /100 | #77 | Exceptional 5.0% |
| Immigrants | Netherlands | 97.8 /100 | #78 | Exceptional 5.0% |
| Turks | 97.6 /100 | #79 | Exceptional 5.0% |
| New Zealanders | 97.4 /100 | #80 | Exceptional 5.0% |
| Filipinos | 97.3 /100 | #81 | Exceptional 5.0% |
| Immigrants | Australia | 97.3 /100 | #82 | Exceptional 5.0% |
| Immigrants | Serbia | 97.2 /100 | #83 | Exceptional 5.0% |
| Canadians | 97.2 /100 | #84 | Exceptional 5.0% |
| Ukrainians | 97.1 /100 | #85 | Exceptional 5.0% |
| Bolivians | 97.1 /100 | #86 | Exceptional 5.0% |
| Venezuelans | 96.9 /100 | #87 | Exceptional 5.0% |
| Immigrants | Sudan | 96.7 /100 | #88 | Exceptional 5.0% |
| Immigrants | Taiwan | 96.6 /100 | #89 | Exceptional 5.0% |