Bangladeshi vs Central American Female Unemployment
COMPARE
Bangladeshi
Central American
Female Unemployment
Female Unemployment Comparison
Bangladeshis
Central Americans
5.2%
FEMALE UNEMPLOYMENT
64.3/ 100
METRIC RATING
164th/ 347
METRIC RANK
5.9%
FEMALE UNEMPLOYMENT
0.0/ 100
METRIC RATING
271st/ 347
METRIC RANK
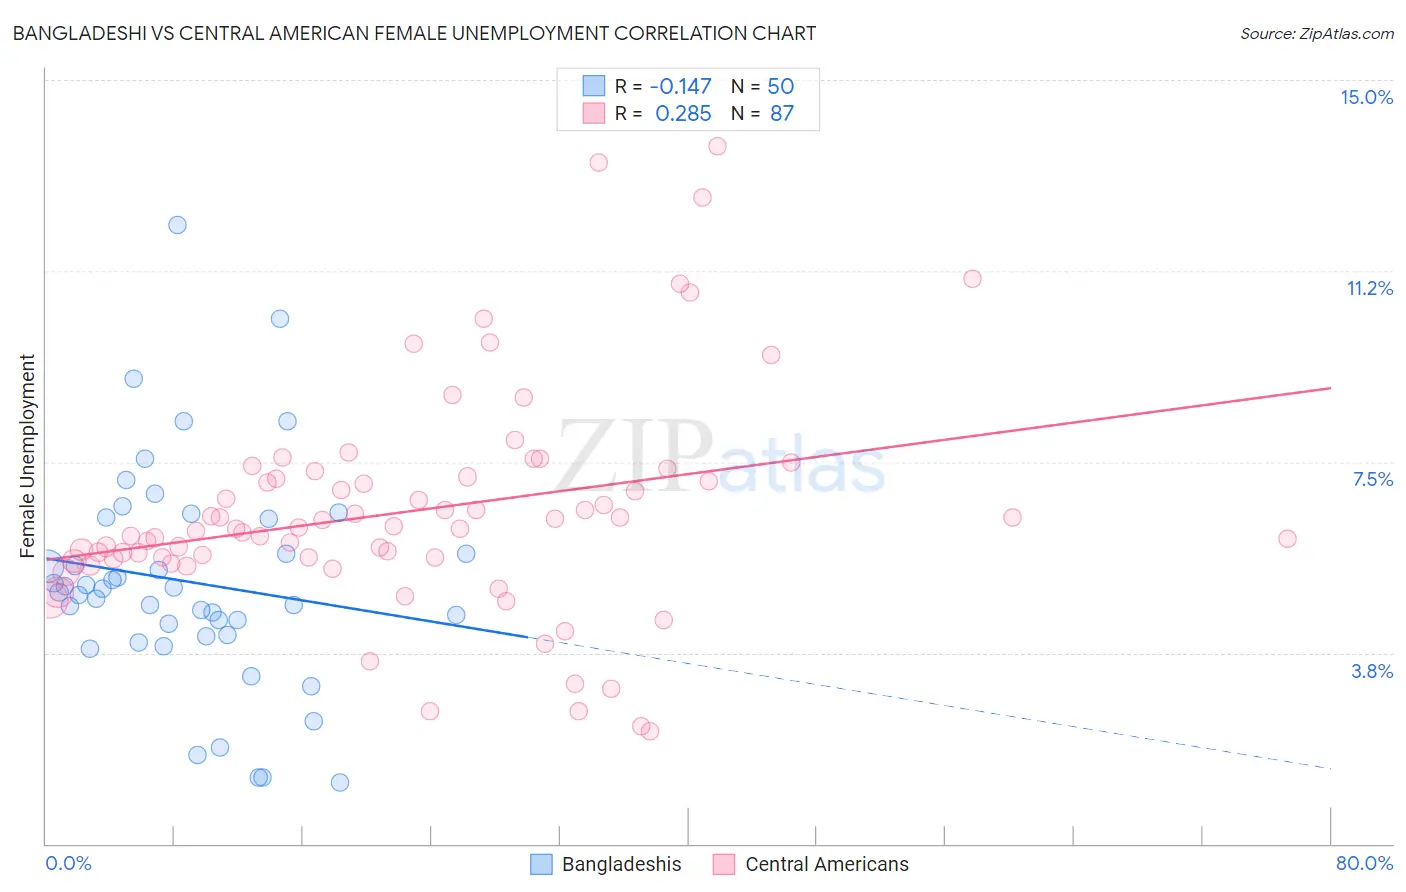
Bangladeshi vs Central American Female Unemployment Correlation Chart
The statistical analysis conducted on geographies consisting of 141,088,133 people shows a poor negative correlation between the proportion of Bangladeshis and unemploymnet rate among females in the United States with a correlation coefficient (R) of -0.147 and weighted average of 5.2%. Similarly, the statistical analysis conducted on geographies consisting of 499,975,290 people shows a weak positive correlation between the proportion of Central Americans and unemploymnet rate among females in the United States with a correlation coefficient (R) of 0.285 and weighted average of 5.9%, a difference of 13.8%.
Female Unemployment Correlation Summary
| Measurement | Bangladeshi | Central American |
| Minimum | 1.2% | 2.2% |
| Maximum | 12.1% | 13.7% |
| Range | 10.9% | 11.5% |
| Mean | 5.1% | 6.5% |
| Median | 5.0% | 6.2% |
| Interquartile 25% (IQ1) | 4.1% | 5.6% |
| Interquartile 75% (IQ3) | 6.4% | 7.2% |
| Interquartile Range (IQR) | 2.3% | 1.6% |
| Standard Deviation (Sample) | 2.2% | 2.2% |
| Standard Deviation (Population) | 2.1% | 2.2% |
Similar Demographics by Female Unemployment
Demographics Similar to Bangladeshis by Female Unemployment
In terms of female unemployment, the demographic groups most similar to Bangladeshis are Immigrants from Asia (5.2%, a difference of 0.0%), Syrian (5.2%, a difference of 0.10%), Native Hawaiian (5.2%, a difference of 0.10%), Potawatomi (5.2%, a difference of 0.11%), and Immigrants from Thailand (5.2%, a difference of 0.14%).
| Demographics | Rating | Rank | Female Unemployment |
| Immigrants | Russia | 69.3 /100 | #157 | Good 5.2% |
| Albanians | 68.3 /100 | #158 | Good 5.2% |
| Immigrants | Micronesia | 66.9 /100 | #159 | Good 5.2% |
| Immigrants | Spain | 66.8 /100 | #160 | Good 5.2% |
| Immigrants | Pakistan | 66.7 /100 | #161 | Good 5.2% |
| Potawatomi | 65.9 /100 | #162 | Good 5.2% |
| Immigrants | Asia | 64.3 /100 | #163 | Good 5.2% |
| Bangladeshis | 64.3 /100 | #164 | Good 5.2% |
| Syrians | 62.8 /100 | #165 | Good 5.2% |
| Native Hawaiians | 62.7 /100 | #166 | Good 5.2% |
| Immigrants | Thailand | 62.1 /100 | #167 | Good 5.2% |
| Sri Lankans | 59.4 /100 | #168 | Average 5.2% |
| Immigrants | Chile | 59.0 /100 | #169 | Average 5.2% |
| Spanish | 55.9 /100 | #170 | Average 5.2% |
| Immigrants | Denmark | 55.0 /100 | #171 | Average 5.2% |
Demographics Similar to Central Americans by Female Unemployment
In terms of female unemployment, the demographic groups most similar to Central Americans are Immigrants from Honduras (5.9%, a difference of 0.10%), Lumbee (5.9%, a difference of 0.19%), Ghanaian (5.9%, a difference of 0.20%), African (5.9%, a difference of 0.28%), and Immigrants from Western Africa (5.9%, a difference of 0.51%).
| Demographics | Rating | Rank | Female Unemployment |
| Immigrants | Bahamas | 0.1 /100 | #264 | Tragic 5.8% |
| Blackfeet | 0.0 /100 | #265 | Tragic 5.9% |
| Cape Verdeans | 0.0 /100 | #266 | Tragic 5.9% |
| Nepalese | 0.0 /100 | #267 | Tragic 5.9% |
| Hondurans | 0.0 /100 | #268 | Tragic 5.9% |
| Immigrants | Western Africa | 0.0 /100 | #269 | Tragic 5.9% |
| Immigrants | Honduras | 0.0 /100 | #270 | Tragic 5.9% |
| Central Americans | 0.0 /100 | #271 | Tragic 5.9% |
| Lumbee | 0.0 /100 | #272 | Tragic 5.9% |
| Ghanaians | 0.0 /100 | #273 | Tragic 5.9% |
| Africans | 0.0 /100 | #274 | Tragic 5.9% |
| Senegalese | 0.0 /100 | #275 | Tragic 6.0% |
| Bahamians | 0.0 /100 | #276 | Tragic 6.0% |
| Immigrants | Ghana | 0.0 /100 | #277 | Tragic 6.0% |
| Yaqui | 0.0 /100 | #278 | Tragic 6.0% |