Bangladeshi vs Immigrants from Australia Female Unemployment

COMPARE

Bangladeshi
Race
Ancestry
AfghanAfricanAlaska NativeAlaskan AthabascanAlbanianAleutAlsatianAmericanApacheArabArapahoArgentineanArmenianAssyrian/Chaldean/SyriacAustralianAustrianBahamianBangladeshiBarbadianBasqueBelgianBelizeanBermudanBhutaneseBlackfeetBolivianBrazilianBritishBritish West IndianBulgarianBurmeseCajunCambodianCanadianCape VerdeanCarpatho RusynCelticCentral AmericanCentral American IndianCherokeeCheyenneChickasawChileanChineseChippewaChoctawColombianColvilleComancheCosta RicanCreeCreekCroatianCrowCubanCypriotCzechCzechoslovakianDanishDelawareDominicanDutchDutch West IndianEastern EuropeanEcuadorianEgyptianEnglishEstonianEthiopianEuropeanFijianFilipinoFinnishFrenchFrench American IndianFrench CanadianGermanGerman RussianGhanaianGreekGuamanian/ChamorroGuatemalanGuyaneseHaitianHmongHonduranHopiHoumaHungarianIcelanderIndian (Asian)IndonesianInupiatIranianIraqiIrishIroquoisIsraeliItalianJamaicanJapaneseJordanianKenyanKiowaKoreanLaotianLatvianLebaneseLiberianLithuanianLumbeeLuxembourgerMacedonianMalaysianMalteseMarshalleseMenomineeMexicanMexican American IndianMongolianMoroccanNative HawaiianNavajoNepaleseNew ZealanderNicaraguanNigerianNorthern EuropeanNorwegianOkinawanOsageOttawaPaiutePakistaniPalestinianPanamanianParaguayanPennsylvania GermanPeruvianPimaPolishPortuguesePotawatomiPuebloPuerto RicanPuget Sound SalishRomanianRussianSalvadoranSamoanScandinavianScotch-IrishScottishSeminoleSenegaleseSerbianShoshoneSierra LeoneanSiouxSlavicSlovakSloveneSomaliSouth AfricanSouth AmericanSouth American IndianSoviet UnionSpaniardSpanishSpanish AmericanSpanish American IndianSri LankanSubsaharan AfricanSudaneseSwedishSwissSyrianTaiwaneseThaiTlingit-HaidaTohono O'OdhamTonganTrinidadian and TobagonianTsimshianTurkishU.S. Virgin IslanderUgandanUkrainianUruguayanUteVenezuelanVietnameseWelshWest IndianYakamaYaquiYugoslavianYumanYup'ikZimbabwean
Immigration
NonimmigrantsImmigrantsAfghanistanAfricaAlbaniaArgentinaArmeniaAsiaAustriaBahamasBangladeshBarbadosBelarusBelgiumBelizeBoliviaBosnia and HerzegovinaBrazilBulgariaBurma/MyanmarCabo VerdeCambodiaCameroonCanadaCaribbeanCentral AmericaChileChinaColombiaCongoCosta RicaCroatiaCubaCzechoslovakiaDenmarkDominicaDominican RepublicEastern AfricaEastern AsiaEastern EuropeEcuadorEgyptEl SalvadorEnglandEritreaEthiopiaEuropeFijiFranceGermanyGhanaGreeceGrenadaGuatemalaGuyanaHaitiHondurasHong KongHungaryIndiaIndonesiaIranIraqIrelandIsraelItalyJamaicaJapanJordanKazakhstanKenyaKoreaKuwaitLaosLatin AmericaLatviaLebanonLiberiaLithuaniaMalaysiaMexicoMicronesiaMiddle AfricaMoldovaMoroccoNepalNetherlandsNicaraguaNigeriaNorth AmericaNorth MacedoniaNorthern AfricaNorthern EuropeNorwayOceaniaPakistanPanamaPeruPhilippinesPolandPortugalRomaniaRussiaSaudi ArabiaScotlandSenegalSerbiaSierra LeoneSingaporeSomaliaSouth AfricaSouth AmericaSouth Central AsiaSouth Eastern AsiaSouthern EuropeSpainSri LankaSt. Vincent and the GrenadinesSudanSwedenSwitzerlandSyriaTaiwanThailandTrinidad and TobagoTurkeyUgandaUkraineUruguayUzbekistanVenezuelaVietnamWest IndiesWestern AfricaWestern AsiaWestern EuropeYemenZaireZimbabweAzores
Immigrants from Australia
Race
Ancestry
AfghanAfricanAlaska NativeAlaskan AthabascanAlbanianAleutAlsatianAmericanApacheArabArapahoArgentineanArmenianAssyrian/Chaldean/SyriacAustralianAustrianBahamianBarbadianBasqueBelgianBelizeanBermudanBhutaneseBlackfeetBolivianBrazilianBritishBritish West IndianBulgarianBurmeseCajunCambodianCanadianCape VerdeanCarpatho RusynCelticCentral AmericanCentral American IndianCherokeeCheyenneChickasawChileanChineseChippewaChoctawColombianColvilleComancheCosta RicanCreeCreekCroatianCrowCubanCypriotCzechCzechoslovakianDanishDelawareDominicanDutchDutch West IndianEastern EuropeanEcuadorianEgyptianEnglishEstonianEthiopianEuropeanFijianFilipinoFinnishFrenchFrench American IndianFrench CanadianGermanGerman RussianGhanaianGreekGuamanian/ChamorroGuatemalanGuyaneseHaitianHmongHonduranHopiHoumaHungarianIcelanderIndian (Asian)IndonesianInupiatIranianIraqiIrishIroquoisIsraeliItalianJamaicanJapaneseJordanianKenyanKiowaKoreanLaotianLatvianLebaneseLiberianLithuanianLumbeeLuxembourgerMacedonianMalaysianMalteseMarshalleseMenomineeMexicanMexican American IndianMongolianMoroccanNative HawaiianNavajoNepaleseNew ZealanderNicaraguanNigerianNorthern EuropeanNorwegianOkinawanOsageOttawaPaiutePakistaniPalestinianPanamanianParaguayanPennsylvania GermanPeruvianPimaPolishPortuguesePotawatomiPuebloPuerto RicanPuget Sound SalishRomanianRussianSalvadoranSamoanScandinavianScotch-IrishScottishSeminoleSenegaleseSerbianShoshoneSierra LeoneanSiouxSlavicSlovakSloveneSomaliSouth AfricanSouth AmericanSouth American IndianSoviet UnionSpaniardSpanishSpanish AmericanSpanish American IndianSri LankanSubsaharan AfricanSudaneseSwedishSwissSyrianTaiwaneseThaiTlingit-HaidaTohono O'OdhamTonganTrinidadian and TobagonianTsimshianTurkishU.S. Virgin IslanderUgandanUkrainianUruguayanUteVenezuelanVietnameseWelshWest IndianYakamaYaquiYugoslavianYumanYup'ikZimbabwean
Immigration
NonimmigrantsImmigrantsAfghanistanAfricaAlbaniaArgentinaArmeniaAsiaAustraliaAustriaBahamasBangladeshBarbadosBelarusBelgiumBelizeBoliviaBosnia and HerzegovinaBrazilBulgariaBurma/MyanmarCabo VerdeCambodiaCameroonCanadaCaribbeanCentral AmericaChileChinaColombiaCongoCosta RicaCroatiaCubaCzechoslovakiaDenmarkDominicaDominican RepublicEastern AfricaEastern AsiaEastern EuropeEcuadorEgyptEl SalvadorEnglandEritreaEthiopiaEuropeFijiFranceGermanyGhanaGreeceGrenadaGuatemalaGuyanaHaitiHondurasHong KongHungaryIndiaIndonesiaIranIraqIrelandIsraelItalyJamaicaJapanJordanKazakhstanKenyaKoreaKuwaitLaosLatin AmericaLatviaLebanonLiberiaLithuaniaMalaysiaMexicoMicronesiaMiddle AfricaMoldovaMoroccoNepalNetherlandsNicaraguaNigeriaNorth AmericaNorth MacedoniaNorthern AfricaNorthern EuropeNorwayOceaniaPakistanPanamaPeruPhilippinesPolandPortugalRomaniaRussiaSaudi ArabiaScotlandSenegalSerbiaSierra LeoneSingaporeSomaliaSouth AfricaSouth AmericaSouth Central AsiaSouth Eastern AsiaSouthern EuropeSpainSri LankaSt. Vincent and the GrenadinesSudanSwedenSwitzerlandSyriaTaiwanThailandTrinidad and TobagoTurkeyUgandaUkraineUruguayUzbekistanVenezuelaVietnamWest IndiesWestern AfricaWestern AsiaWestern EuropeYemenZaireZimbabweAzores
Female Unemployment
Income
Poverty
Unemployment
Labor Participation
Family Structure
Vehicle Availability
Education Level
Disability

Female Unemployment Comparison

Bangladeshis

Immigrants from Australia

Good
Exceptional
5.2%
FEMALE UNEMPLOYMENT
64.3/ 100
METRIC RATING
164th/ 347
METRIC RANK
5.0%
FEMALE UNEMPLOYMENT
97.3/ 100
METRIC RATING
82nd/ 347
METRIC RANK

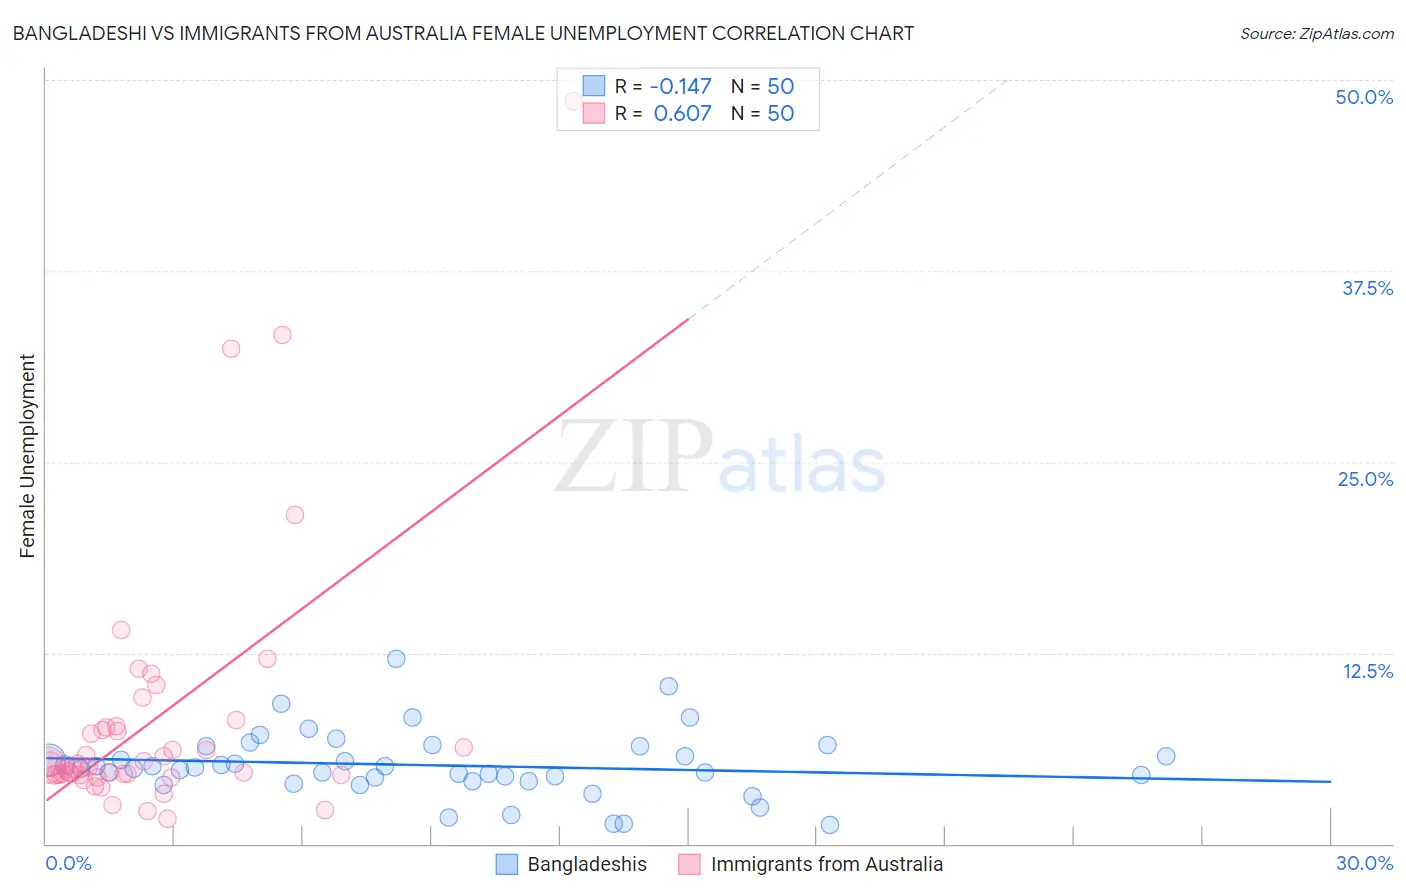
Bangladeshi vs Immigrants from Australia Female Unemployment Correlation Chart

The statistical analysis conducted on geographies consisting of 141,088,133 people shows a poor negative correlation between the proportion of Bangladeshis and unemploymnet rate among females in the United States with a correlation coefficient (R) of -0.147 and weighted average of 5.2%. Similarly, the statistical analysis conducted on geographies consisting of 226,659,190 people shows a significant positive correlation between the proportion of Immigrants from Australia and unemploymnet rate among females in the United States with a correlation coefficient (R) of 0.607 and weighted average of 5.0%, a difference of 4.7%.
Bangladeshi vs Immigrants from Australia Female Unemployment

Female Unemployment Correlation Summary

MeasurementBangladeshiImmigrants from Australia
Minimum1.2%1.6%
Maximum12.1%48.6%
Range10.9%47.0%
Mean5.1%8.1%
Median5.0%5.1%
Interquartile 25% (IQ1)4.1%4.5%
Interquartile 75% (IQ3)6.4%7.6%
Interquartile Range (IQR)2.3%3.1%
Standard Deviation (Sample)2.2%8.6%
Standard Deviation (Population)2.1%8.5%

Similar Demographics by Female Unemployment

Demographics Similar to Bangladeshis by Female Unemployment

In terms of female unemployment, the demographic groups most similar to Bangladeshis are Immigrants from Asia (5.2%, a difference of 0.0%), Syrian (5.2%, a difference of 0.10%), Native Hawaiian (5.2%, a difference of 0.10%), Potawatomi (5.2%, a difference of 0.11%), and Immigrants from Thailand (5.2%, a difference of 0.14%).
DemographicsRating | RankFemale Unemployment
Immigrants | Russia
69.3
/100
|
#157
Good
5.2%
Albanians
68.3
/100
|
#158
Good
5.2%
Immigrants | Micronesia
66.9
/100
|
#159
Good
5.2%
Immigrants | Spain
66.8
/100
|
#160
Good
5.2%
Immigrants | Pakistan
66.7
/100
|
#161
Good
5.2%
Potawatomi
65.9
/100
|
#162
Good
5.2%
Immigrants | Asia
64.3
/100
|
#163
Good
5.2%
Bangladeshis
64.3
/100
|
#164
Good
5.2%
Syrians
62.8
/100
|
#165
Good
5.2%
Native Hawaiians
62.7
/100
|
#166
Good
5.2%
Immigrants | Thailand
62.1
/100
|
#167
Good
5.2%
Sri Lankans
59.4
/100
|
#168
Average
5.2%
Immigrants | Chile
59.0
/100
|
#169
Average
5.2%
Spanish
55.9
/100
|
#170
Average
5.2%
Immigrants | Denmark
55.0
/100
|
#171
Average
5.2%

Demographics Similar to Immigrants from Australia by Female Unemployment

In terms of female unemployment, the demographic groups most similar to Immigrants from Australia are Immigrants from Serbia (5.0%, a difference of 0.020%), Filipino (5.0%, a difference of 0.050%), Canadian (5.0%, a difference of 0.050%), New Zealander (5.0%, a difference of 0.070%), and Ukrainian (5.0%, a difference of 0.090%).
DemographicsRating | RankFemale Unemployment
Immigrants | Singapore
98.0
/100
|
#75
Exceptional
5.0%
Immigrants | Venezuela
97.9
/100
|
#76
Exceptional
5.0%
Mongolians
97.8
/100
|
#77
Exceptional
5.0%
Immigrants | Netherlands
97.8
/100
|
#78
Exceptional
5.0%
Turks
97.6
/100
|
#79
Exceptional
5.0%
New Zealanders
97.4
/100
|
#80
Exceptional
5.0%
Filipinos
97.3
/100
|
#81
Exceptional
5.0%
Immigrants | Australia
97.3
/100
|
#82
Exceptional
5.0%
Immigrants | Serbia
97.2
/100
|
#83
Exceptional
5.0%
Canadians
97.2
/100
|
#84
Exceptional
5.0%
Ukrainians
97.1
/100
|
#85
Exceptional
5.0%
Bolivians
97.1
/100
|
#86
Exceptional
5.0%
Venezuelans
96.9
/100
|
#87
Exceptional
5.0%
Immigrants | Sudan
96.7
/100
|
#88
Exceptional
5.0%
Immigrants | Taiwan
96.6
/100
|
#89
Exceptional
5.0%