Australian vs Serbian Male Unemployment
COMPARE
Australian
Serbian
Male Unemployment
Male Unemployment Comparison
Australians
Serbians
5.0%
MALE UNEMPLOYMENT
97.4/ 100
METRIC RATING
68th/ 347
METRIC RANK
5.1%
MALE UNEMPLOYMENT
95.7/ 100
METRIC RATING
84th/ 347
METRIC RANK
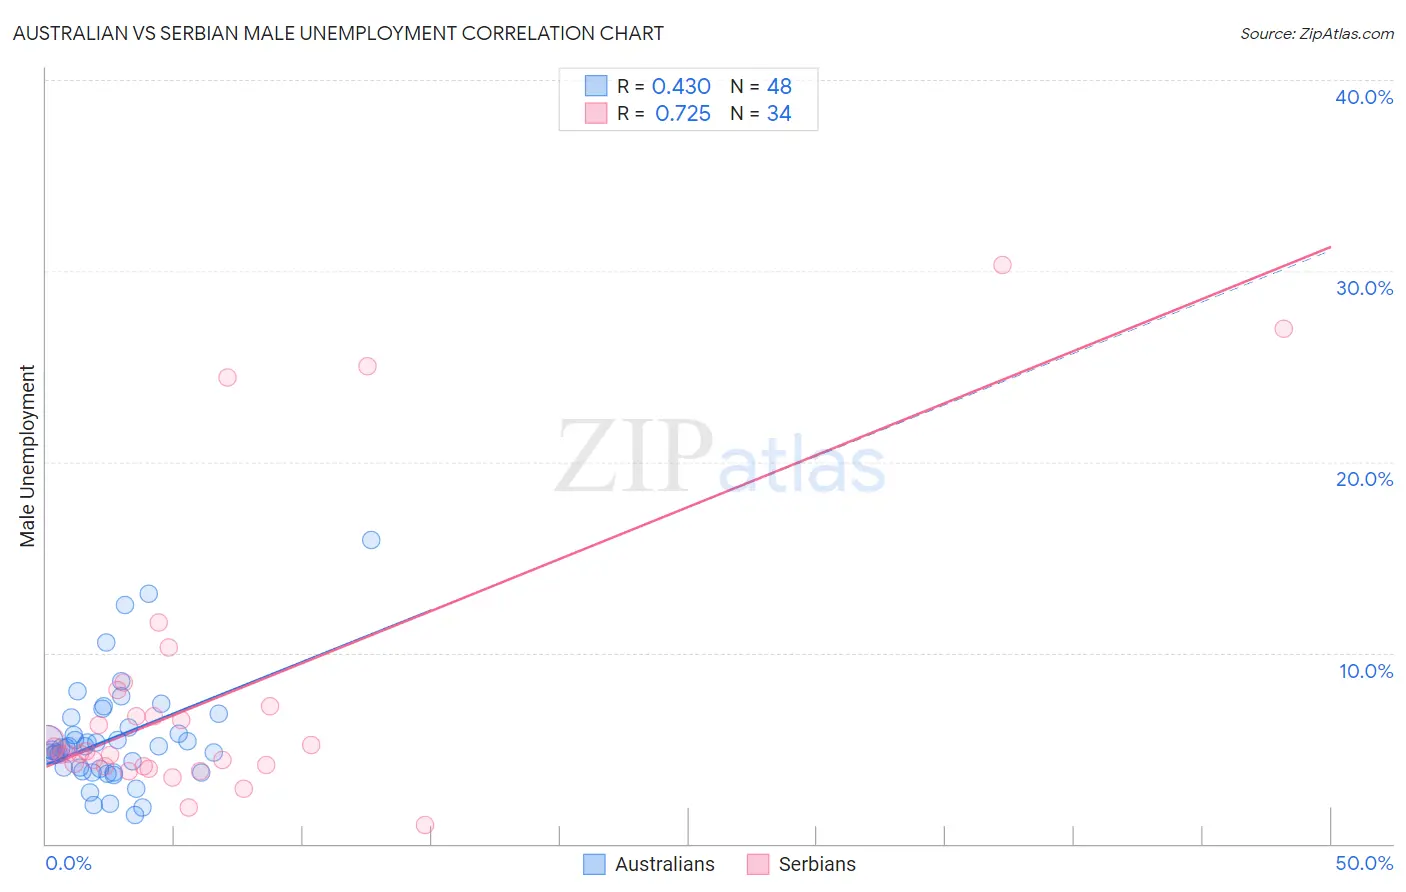
Australian vs Serbian Male Unemployment Correlation Chart
The statistical analysis conducted on geographies consisting of 223,647,847 people shows a moderate positive correlation between the proportion of Australians and unemployment rate among males in the United States with a correlation coefficient (R) of 0.430 and weighted average of 5.0%. Similarly, the statistical analysis conducted on geographies consisting of 266,907,667 people shows a strong positive correlation between the proportion of Serbians and unemployment rate among males in the United States with a correlation coefficient (R) of 0.725 and weighted average of 5.1%, a difference of 0.82%.
Male Unemployment Correlation Summary
| Measurement | Australian | Serbian |
| Minimum | 1.5% | 1.0% |
| Maximum | 15.9% | 30.3% |
| Range | 14.4% | 29.3% |
| Mean | 5.6% | 7.7% |
| Median | 5.1% | 4.8% |
| Interquartile 25% (IQ1) | 3.8% | 4.1% |
| Interquartile 75% (IQ3) | 6.3% | 7.2% |
| Interquartile Range (IQR) | 2.5% | 3.1% |
| Standard Deviation (Sample) | 2.8% | 7.4% |
| Standard Deviation (Population) | 2.8% | 7.3% |
Demographics Similar to Australians and Serbians by Male Unemployment
In terms of male unemployment, the demographic groups most similar to Australians are Immigrants from Canada (5.0%, a difference of 0.010%), Finnish (5.0%, a difference of 0.030%), Immigrants from Sweden (5.0%, a difference of 0.030%), White/Caucasian (5.0%, a difference of 0.080%), and New Zealander (5.0%, a difference of 0.10%). Similarly, the demographic groups most similar to Serbians are Immigrants from North Macedonia (5.1%, a difference of 0.050%), Maltese (5.1%, a difference of 0.090%), Immigrants from Eritrea (5.0%, a difference of 0.12%), Chilean (5.0%, a difference of 0.17%), and Argentinean (5.0%, a difference of 0.21%).
| Demographics | Rating | Rank | Male Unemployment |
| Finns | 97.5 /100 | #66 | Exceptional 5.0% |
| Immigrants | Canada | 97.5 /100 | #67 | Exceptional 5.0% |
| Australians | 97.4 /100 | #68 | Exceptional 5.0% |
| Immigrants | Sweden | 97.4 /100 | #69 | Exceptional 5.0% |
| Whites/Caucasians | 97.3 /100 | #70 | Exceptional 5.0% |
| New Zealanders | 97.3 /100 | #71 | Exceptional 5.0% |
| Immigrants | South Africa | 97.1 /100 | #72 | Exceptional 5.0% |
| Greeks | 97.0 /100 | #73 | Exceptional 5.0% |
| Immigrants | North America | 96.9 /100 | #74 | Exceptional 5.0% |
| Assyrians/Chaldeans/Syriacs | 96.9 /100 | #75 | Exceptional 5.0% |
| Immigrants | Sudan | 96.5 /100 | #76 | Exceptional 5.0% |
| Iranians | 96.4 /100 | #77 | Exceptional 5.0% |
| Immigrants | Northern Europe | 96.4 /100 | #78 | Exceptional 5.0% |
| South Africans | 96.4 /100 | #79 | Exceptional 5.0% |
| Argentineans | 96.2 /100 | #80 | Exceptional 5.0% |
| French | 96.2 /100 | #81 | Exceptional 5.0% |
| Chileans | 96.2 /100 | #82 | Exceptional 5.0% |
| Immigrants | Eritrea | 96.0 /100 | #83 | Exceptional 5.0% |
| Serbians | 95.7 /100 | #84 | Exceptional 5.1% |
| Immigrants | North Macedonia | 95.6 /100 | #85 | Exceptional 5.1% |
| Maltese | 95.5 /100 | #86 | Exceptional 5.1% |