Australian vs Immigrants from Lebanon Male Unemployment
COMPARE
Australian
Immigrants from Lebanon
Male Unemployment
Male Unemployment Comparison
Australians
Immigrants from Lebanon
5.0%
MALE UNEMPLOYMENT
97.4/ 100
METRIC RATING
68th/ 347
METRIC RANK
5.5%
MALE UNEMPLOYMENT
8.6/ 100
METRIC RATING
208th/ 347
METRIC RANK
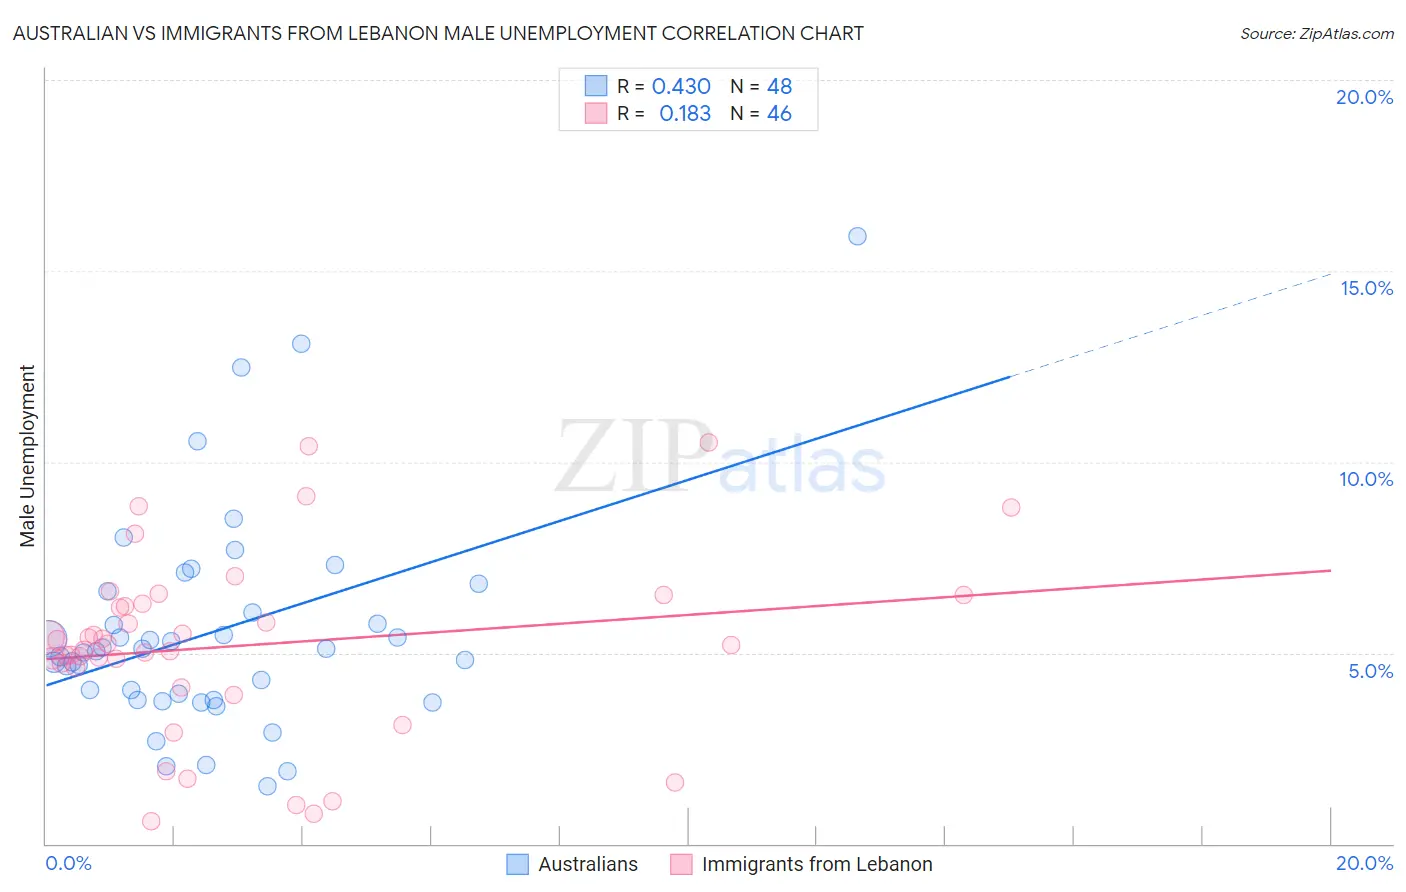
Australian vs Immigrants from Lebanon Male Unemployment Correlation Chart
The statistical analysis conducted on geographies consisting of 223,647,847 people shows a moderate positive correlation between the proportion of Australians and unemployment rate among males in the United States with a correlation coefficient (R) of 0.430 and weighted average of 5.0%. Similarly, the statistical analysis conducted on geographies consisting of 216,995,040 people shows a poor positive correlation between the proportion of Immigrants from Lebanon and unemployment rate among males in the United States with a correlation coefficient (R) of 0.183 and weighted average of 5.5%, a difference of 9.3%.
Male Unemployment Correlation Summary
| Measurement | Australian | Immigrants from Lebanon |
| Minimum | 1.5% | 0.59% |
| Maximum | 15.9% | 10.5% |
| Range | 14.4% | 9.9% |
| Mean | 5.6% | 5.2% |
| Median | 5.1% | 5.2% |
| Interquartile 25% (IQ1) | 3.8% | 4.6% |
| Interquartile 75% (IQ3) | 6.3% | 6.3% |
| Interquartile Range (IQR) | 2.5% | 1.7% |
| Standard Deviation (Sample) | 2.8% | 2.3% |
| Standard Deviation (Population) | 2.8% | 2.3% |
Similar Demographics by Male Unemployment
Demographics Similar to Australians by Male Unemployment
In terms of male unemployment, the demographic groups most similar to Australians are Immigrants from Canada (5.0%, a difference of 0.010%), Finnish (5.0%, a difference of 0.030%), Immigrants from Sweden (5.0%, a difference of 0.030%), White/Caucasian (5.0%, a difference of 0.080%), and New Zealander (5.0%, a difference of 0.10%).
| Demographics | Rating | Rank | Male Unemployment |
| Cambodians | 98.1 /100 | #61 | Exceptional 5.0% |
| Basques | 97.9 /100 | #62 | Exceptional 5.0% |
| Eastern Europeans | 97.9 /100 | #63 | Exceptional 5.0% |
| Celtics | 97.8 /100 | #64 | Exceptional 5.0% |
| Icelanders | 97.6 /100 | #65 | Exceptional 5.0% |
| Finns | 97.5 /100 | #66 | Exceptional 5.0% |
| Immigrants | Canada | 97.5 /100 | #67 | Exceptional 5.0% |
| Australians | 97.4 /100 | #68 | Exceptional 5.0% |
| Immigrants | Sweden | 97.4 /100 | #69 | Exceptional 5.0% |
| Whites/Caucasians | 97.3 /100 | #70 | Exceptional 5.0% |
| New Zealanders | 97.3 /100 | #71 | Exceptional 5.0% |
| Immigrants | South Africa | 97.1 /100 | #72 | Exceptional 5.0% |
| Greeks | 97.0 /100 | #73 | Exceptional 5.0% |
| Immigrants | North America | 96.9 /100 | #74 | Exceptional 5.0% |
| Assyrians/Chaldeans/Syriacs | 96.9 /100 | #75 | Exceptional 5.0% |
Demographics Similar to Immigrants from Lebanon by Male Unemployment
In terms of male unemployment, the demographic groups most similar to Immigrants from Lebanon are Immigrants from Middle Africa (5.5%, a difference of 0.050%), Immigrants from Syria (5.5%, a difference of 0.13%), South American Indian (5.5%, a difference of 0.18%), Israeli (5.5%, a difference of 0.22%), and Immigrants from Ukraine (5.5%, a difference of 0.23%).
| Demographics | Rating | Rank | Male Unemployment |
| Immigrants | Philippines | 13.5 /100 | #201 | Poor 5.4% |
| Immigrants | Nonimmigrants | 13.1 /100 | #202 | Poor 5.4% |
| Immigrants | Laos | 13.0 /100 | #203 | Poor 5.4% |
| Guamanians/Chamorros | 12.3 /100 | #204 | Poor 5.4% |
| Immigrants | Costa Rica | 11.4 /100 | #205 | Poor 5.5% |
| Immigrants | Ukraine | 9.9 /100 | #206 | Tragic 5.5% |
| Immigrants | Syria | 9.3 /100 | #207 | Tragic 5.5% |
| Immigrants | Lebanon | 8.6 /100 | #208 | Tragic 5.5% |
| Immigrants | Middle Africa | 8.3 /100 | #209 | Tragic 5.5% |
| South American Indians | 7.6 /100 | #210 | Tragic 5.5% |
| Israelis | 7.4 /100 | #211 | Tragic 5.5% |
| Hmong | 7.0 /100 | #212 | Tragic 5.5% |
| Ugandans | 6.3 /100 | #213 | Tragic 5.5% |
| Puget Sound Salish | 5.6 /100 | #214 | Tragic 5.5% |
| Samoans | 4.9 /100 | #215 | Tragic 5.5% |