Assyrian/Chaldean/Syriac vs Tlingit-Haida Unemployment Among Ages 20 to 24 years
COMPARE
Assyrian/Chaldean/Syriac
Tlingit-Haida
Unemployment Among Ages 20 to 24 years
Unemployment Among Ages 20 to 24 years Comparison
Assyrians/Chaldeans/Syriacs
Tlingit-Haida
9.9%
UNEMPLOYMENT AMONG AGES 20 TO 24 YEARS
98.3/ 100
METRIC RATING
78th/ 347
METRIC RANK
10.3%
UNEMPLOYMENT AMONG AGES 20 TO 24 YEARS
39.7/ 100
METRIC RATING
179th/ 347
METRIC RANK
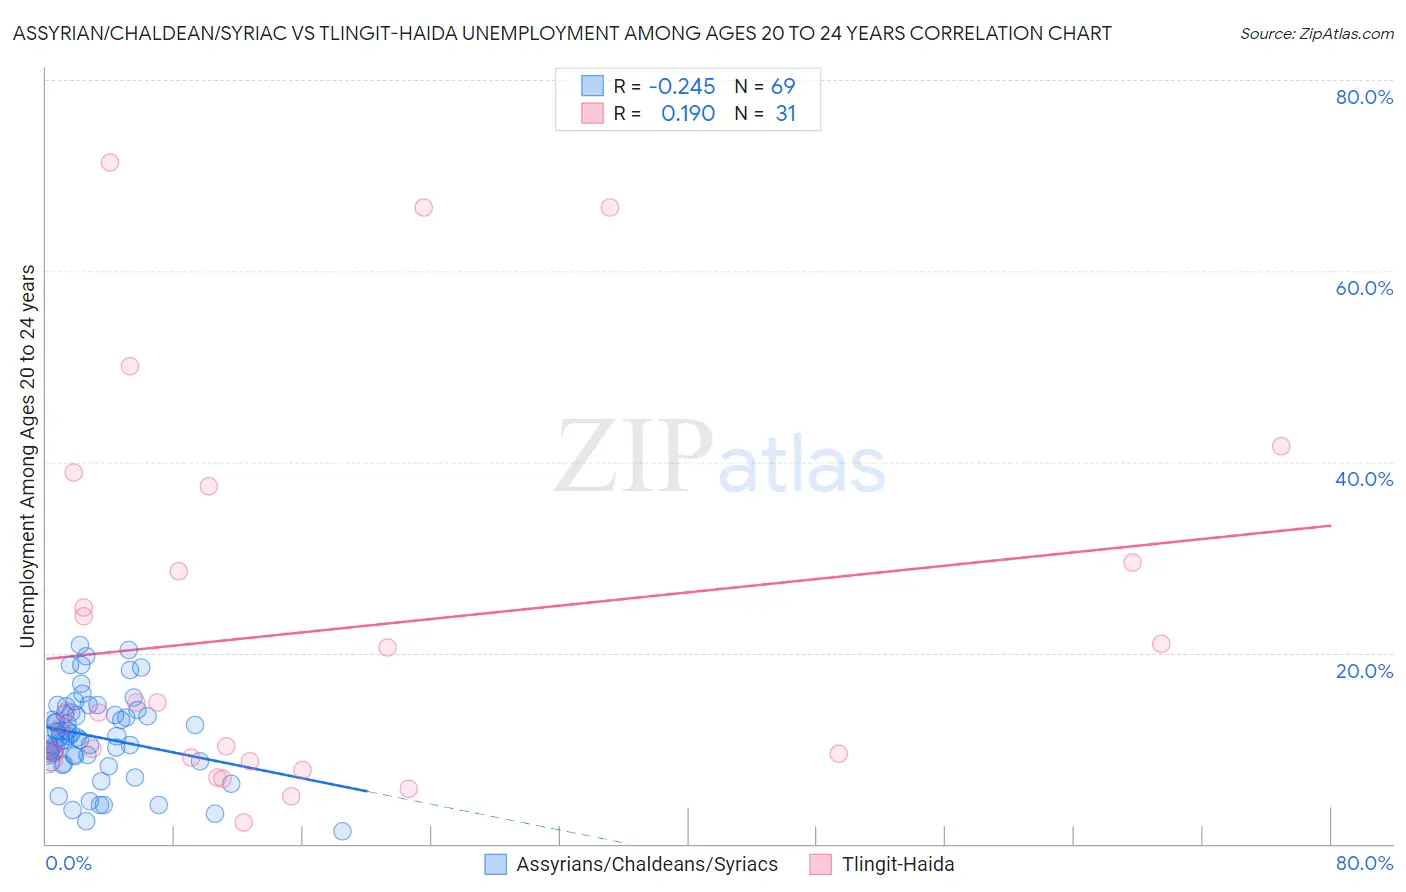
Assyrian/Chaldean/Syriac vs Tlingit-Haida Unemployment Among Ages 20 to 24 years Correlation Chart
The statistical analysis conducted on geographies consisting of 109,491,073 people shows a weak negative correlation between the proportion of Assyrians/Chaldeans/Syriacs and unemployment rate among population between the ages 20 and 24 in the United States with a correlation coefficient (R) of -0.245 and weighted average of 9.9%. Similarly, the statistical analysis conducted on geographies consisting of 60,175,372 people shows a poor positive correlation between the proportion of Tlingit-Haida and unemployment rate among population between the ages 20 and 24 in the United States with a correlation coefficient (R) of 0.190 and weighted average of 10.3%, a difference of 4.3%.
Unemployment Among Ages 20 to 24 years Correlation Summary
| Measurement | Assyrian/Chaldean/Syriac | Tlingit-Haida |
| Minimum | 1.3% | 2.2% |
| Maximum | 20.8% | 71.4% |
| Range | 19.5% | 69.2% |
| Mean | 11.2% | 22.3% |
| Median | 11.2% | 13.9% |
| Interquartile 25% (IQ1) | 8.9% | 9.0% |
| Interquartile 75% (IQ3) | 13.7% | 29.4% |
| Interquartile Range (IQR) | 4.8% | 20.4% |
| Standard Deviation (Sample) | 4.4% | 19.4% |
| Standard Deviation (Population) | 4.3% | 19.1% |
Similar Demographics by Unemployment Among Ages 20 to 24 years
Demographics Similar to Assyrians/Chaldeans/Syriacs by Unemployment Among Ages 20 to 24 years
In terms of unemployment among ages 20 to 24 years, the demographic groups most similar to Assyrians/Chaldeans/Syriacs are Icelander (9.9%, a difference of 0.020%), Chickasaw (9.9%, a difference of 0.030%), Czechoslovakian (9.9%, a difference of 0.050%), Immigrants from Netherlands (9.9%, a difference of 0.070%), and Immigrants from Australia (9.9%, a difference of 0.14%).
| Demographics | Rating | Rank | Unemployment Among Ages 20 to 24 years |
| Celtics | 98.9 /100 | #71 | Exceptional 9.9% |
| Bolivians | 98.9 /100 | #72 | Exceptional 9.9% |
| Kenyans | 98.7 /100 | #73 | Exceptional 9.9% |
| Immigrants | Laos | 98.7 /100 | #74 | Exceptional 9.9% |
| Immigrants | Australia | 98.6 /100 | #75 | Exceptional 9.9% |
| Czechoslovakians | 98.4 /100 | #76 | Exceptional 9.9% |
| Chickasaw | 98.4 /100 | #77 | Exceptional 9.9% |
| Assyrians/Chaldeans/Syriacs | 98.3 /100 | #78 | Exceptional 9.9% |
| Icelanders | 98.3 /100 | #79 | Exceptional 9.9% |
| Immigrants | Netherlands | 98.2 /100 | #80 | Exceptional 9.9% |
| Yaqui | 98.0 /100 | #81 | Exceptional 9.9% |
| Sri Lankans | 98.0 /100 | #82 | Exceptional 9.9% |
| Immigrants | Bulgaria | 98.0 /100 | #83 | Exceptional 9.9% |
| Latvians | 97.9 /100 | #84 | Exceptional 9.9% |
| New Zealanders | 97.8 /100 | #85 | Exceptional 9.9% |
Demographics Similar to Tlingit-Haida by Unemployment Among Ages 20 to 24 years
In terms of unemployment among ages 20 to 24 years, the demographic groups most similar to Tlingit-Haida are Immigrants from Turkey (10.3%, a difference of 0.010%), Okinawan (10.3%, a difference of 0.020%), Alsatian (10.3%, a difference of 0.030%), Immigrants from Czechoslovakia (10.3%, a difference of 0.040%), and Immigrants from Germany (10.4%, a difference of 0.060%).
| Demographics | Rating | Rank | Unemployment Among Ages 20 to 24 years |
| Koreans | 51.9 /100 | #172 | Average 10.3% |
| Immigrants | Sweden | 50.8 /100 | #173 | Average 10.3% |
| Ukrainians | 50.0 /100 | #174 | Average 10.3% |
| Samoans | 45.4 /100 | #175 | Average 10.3% |
| Potawatomi | 42.0 /100 | #176 | Average 10.3% |
| Immigrants | Czechoslovakia | 40.8 /100 | #177 | Average 10.3% |
| Alsatians | 40.5 /100 | #178 | Average 10.3% |
| Tlingit-Haida | 39.7 /100 | #179 | Fair 10.3% |
| Immigrants | Turkey | 39.3 /100 | #180 | Fair 10.3% |
| Okinawans | 39.1 /100 | #181 | Fair 10.3% |
| Immigrants | Germany | 38.1 /100 | #182 | Fair 10.4% |
| Immigrants | Egypt | 37.4 /100 | #183 | Fair 10.4% |
| Greeks | 37.2 /100 | #184 | Fair 10.4% |
| Syrians | 35.6 /100 | #185 | Fair 10.4% |
| Guamanians/Chamorros | 35.4 /100 | #186 | Fair 10.4% |