Assyrian/Chaldean/Syriac vs Alaska Native Unemployment Among Ages 20 to 24 years
COMPARE
Assyrian/Chaldean/Syriac
Alaska Native
Unemployment Among Ages 20 to 24 years
Unemployment Among Ages 20 to 24 years Comparison
Assyrians/Chaldeans/Syriacs
Alaska Natives
9.9%
UNEMPLOYMENT AMONG AGES 20 TO 24 YEARS
98.3/ 100
METRIC RATING
78th/ 347
METRIC RANK
13.2%
UNEMPLOYMENT AMONG AGES 20 TO 24 YEARS
0.0/ 100
METRIC RATING
324th/ 347
METRIC RANK
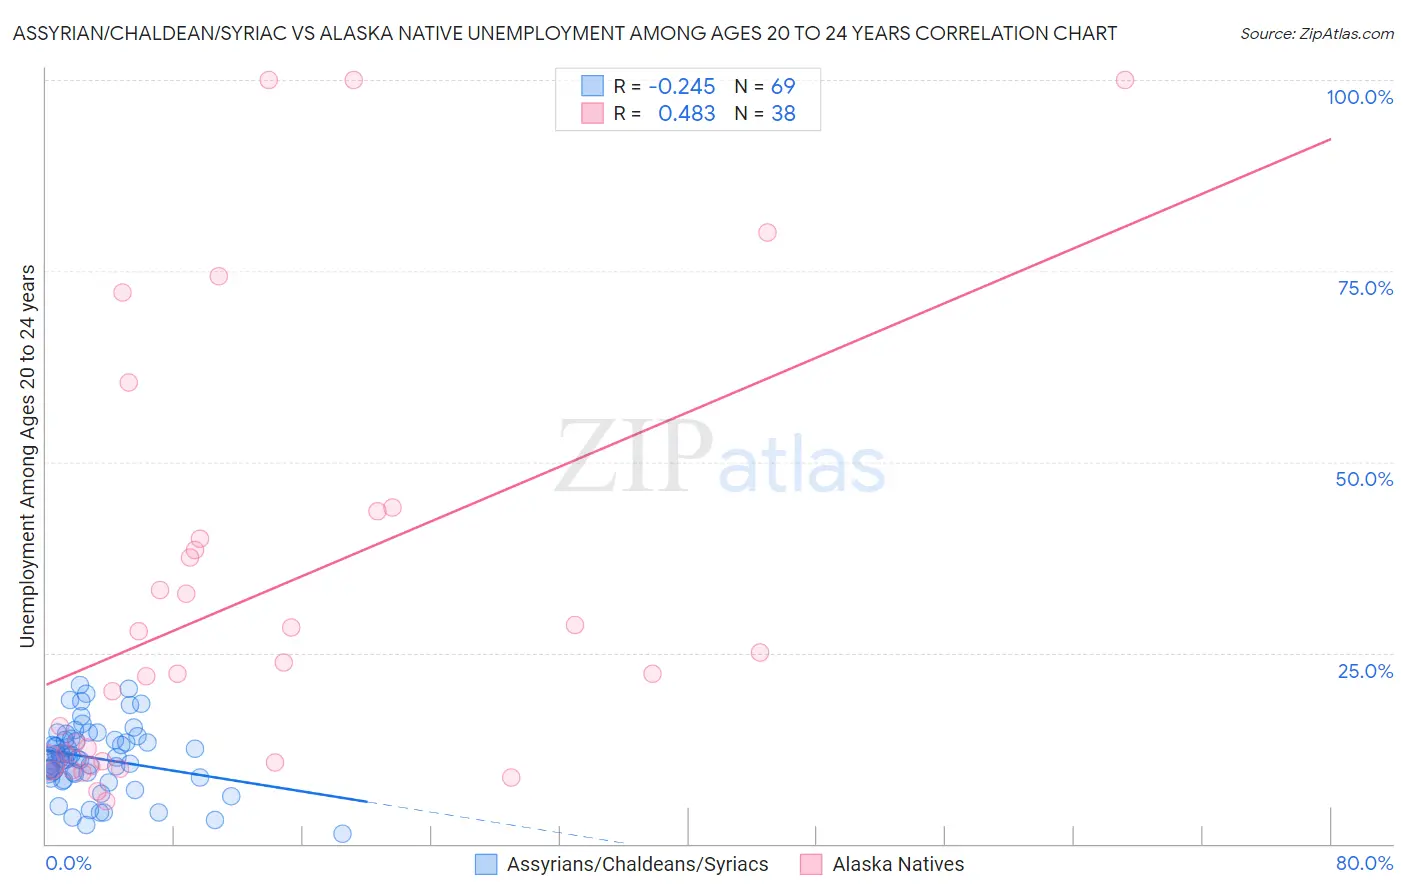
Assyrian/Chaldean/Syriac vs Alaska Native Unemployment Among Ages 20 to 24 years Correlation Chart
The statistical analysis conducted on geographies consisting of 109,491,073 people shows a weak negative correlation between the proportion of Assyrians/Chaldeans/Syriacs and unemployment rate among population between the ages 20 and 24 in the United States with a correlation coefficient (R) of -0.245 and weighted average of 9.9%. Similarly, the statistical analysis conducted on geographies consisting of 76,203,716 people shows a moderate positive correlation between the proportion of Alaska Natives and unemployment rate among population between the ages 20 and 24 in the United States with a correlation coefficient (R) of 0.483 and weighted average of 13.2%, a difference of 33.1%.
Unemployment Among Ages 20 to 24 years Correlation Summary
| Measurement | Assyrian/Chaldean/Syriac | Alaska Native |
| Minimum | 1.3% | 5.6% |
| Maximum | 20.8% | 100.0% |
| Range | 19.5% | 94.4% |
| Mean | 11.2% | 32.4% |
| Median | 11.2% | 22.9% |
| Interquartile 25% (IQ1) | 8.9% | 10.6% |
| Interquartile 75% (IQ3) | 13.7% | 40.0% |
| Interquartile Range (IQR) | 4.8% | 29.4% |
| Standard Deviation (Sample) | 4.4% | 27.8% |
| Standard Deviation (Population) | 4.3% | 27.4% |
Similar Demographics by Unemployment Among Ages 20 to 24 years
Demographics Similar to Assyrians/Chaldeans/Syriacs by Unemployment Among Ages 20 to 24 years
In terms of unemployment among ages 20 to 24 years, the demographic groups most similar to Assyrians/Chaldeans/Syriacs are Icelander (9.9%, a difference of 0.020%), Chickasaw (9.9%, a difference of 0.030%), Czechoslovakian (9.9%, a difference of 0.050%), Immigrants from Netherlands (9.9%, a difference of 0.070%), and Immigrants from Australia (9.9%, a difference of 0.14%).
| Demographics | Rating | Rank | Unemployment Among Ages 20 to 24 years |
| Celtics | 98.9 /100 | #71 | Exceptional 9.9% |
| Bolivians | 98.9 /100 | #72 | Exceptional 9.9% |
| Kenyans | 98.7 /100 | #73 | Exceptional 9.9% |
| Immigrants | Laos | 98.7 /100 | #74 | Exceptional 9.9% |
| Immigrants | Australia | 98.6 /100 | #75 | Exceptional 9.9% |
| Czechoslovakians | 98.4 /100 | #76 | Exceptional 9.9% |
| Chickasaw | 98.4 /100 | #77 | Exceptional 9.9% |
| Assyrians/Chaldeans/Syriacs | 98.3 /100 | #78 | Exceptional 9.9% |
| Icelanders | 98.3 /100 | #79 | Exceptional 9.9% |
| Immigrants | Netherlands | 98.2 /100 | #80 | Exceptional 9.9% |
| Yaqui | 98.0 /100 | #81 | Exceptional 9.9% |
| Sri Lankans | 98.0 /100 | #82 | Exceptional 9.9% |
| Immigrants | Bulgaria | 98.0 /100 | #83 | Exceptional 9.9% |
| Latvians | 97.9 /100 | #84 | Exceptional 9.9% |
| New Zealanders | 97.8 /100 | #85 | Exceptional 9.9% |
Demographics Similar to Alaska Natives by Unemployment Among Ages 20 to 24 years
In terms of unemployment among ages 20 to 24 years, the demographic groups most similar to Alaska Natives are Pueblo (13.2%, a difference of 0.22%), Yakama (13.1%, a difference of 0.98%), Native/Alaskan (13.0%, a difference of 1.5%), Immigrants from Jamaica (13.0%, a difference of 1.8%), and Cheyenne (13.0%, a difference of 1.9%).
| Demographics | Rating | Rank | Unemployment Among Ages 20 to 24 years |
| Immigrants | Trinidad and Tobago | 0.0 /100 | #317 | Tragic 12.8% |
| Barbadians | 0.0 /100 | #318 | Tragic 12.9% |
| Trinidadians and Tobagonians | 0.0 /100 | #319 | Tragic 12.9% |
| Cheyenne | 0.0 /100 | #320 | Tragic 13.0% |
| Immigrants | Jamaica | 0.0 /100 | #321 | Tragic 13.0% |
| Natives/Alaskans | 0.0 /100 | #322 | Tragic 13.0% |
| Yakama | 0.0 /100 | #323 | Tragic 13.1% |
| Alaska Natives | 0.0 /100 | #324 | Tragic 13.2% |
| Pueblo | 0.0 /100 | #325 | Tragic 13.2% |
| Immigrants | Barbados | 0.0 /100 | #326 | Tragic 13.5% |
| Immigrants | Dominican Republic | 0.0 /100 | #327 | Tragic 13.6% |
| British West Indians | 0.0 /100 | #328 | Tragic 13.7% |
| Dominicans | 0.0 /100 | #329 | Tragic 13.8% |
| Arapaho | 0.0 /100 | #330 | Tragic 13.8% |
| Aleuts | 0.0 /100 | #331 | Tragic 13.8% |