Celtic vs Bhutanese Unemployment Among Ages 20 to 24 years
COMPARE
Celtic
Bhutanese
Unemployment Among Ages 20 to 24 years
Unemployment Among Ages 20 to 24 years Comparison
Celtics
Bhutanese
9.9%
UNEMPLOYMENT AMONG AGES 20 TO 24 YEARS
98.9/ 100
METRIC RATING
71st/ 347
METRIC RANK
10.0%
UNEMPLOYMENT AMONG AGES 20 TO 24 YEARS
96.9/ 100
METRIC RATING
91st/ 347
METRIC RANK
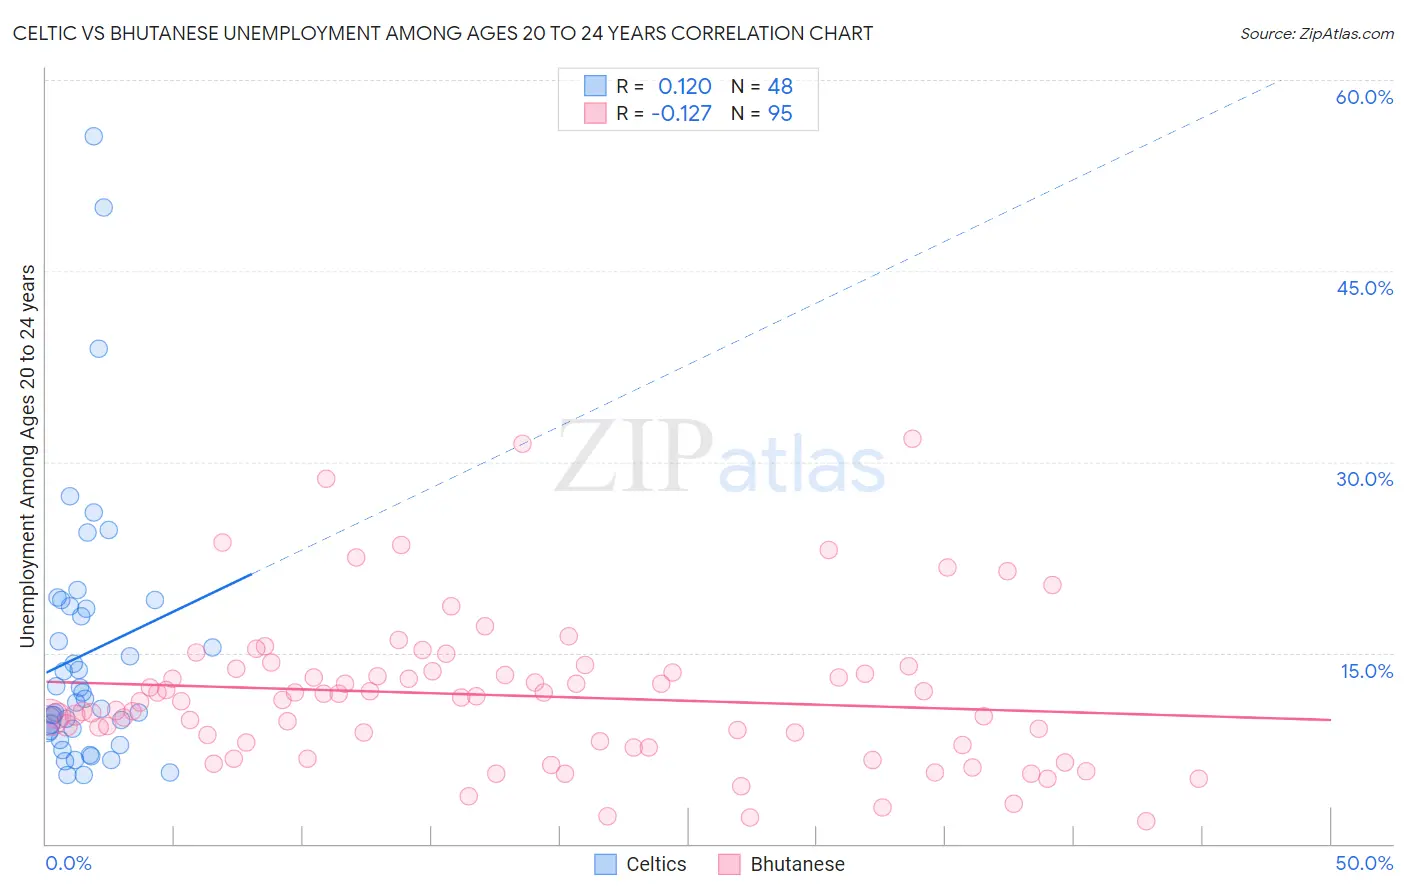
Celtic vs Bhutanese Unemployment Among Ages 20 to 24 years Correlation Chart
The statistical analysis conducted on geographies consisting of 165,509,552 people shows a poor positive correlation between the proportion of Celtics and unemployment rate among population between the ages 20 and 24 in the United States with a correlation coefficient (R) of 0.120 and weighted average of 9.9%. Similarly, the statistical analysis conducted on geographies consisting of 437,376,802 people shows a poor negative correlation between the proportion of Bhutanese and unemployment rate among population between the ages 20 and 24 in the United States with a correlation coefficient (R) of -0.127 and weighted average of 10.0%, a difference of 1.0%.
Unemployment Among Ages 20 to 24 years Correlation Summary
| Measurement | Celtic | Bhutanese |
| Minimum | 5.4% | 1.8% |
| Maximum | 55.6% | 31.8% |
| Range | 50.2% | 30.0% |
| Mean | 14.9% | 11.6% |
| Median | 11.3% | 11.3% |
| Interquartile 25% (IQ1) | 8.8% | 7.8% |
| Interquartile 75% (IQ3) | 18.6% | 13.6% |
| Interquartile Range (IQR) | 9.7% | 5.8% |
| Standard Deviation (Sample) | 10.5% | 5.9% |
| Standard Deviation (Population) | 10.4% | 5.9% |
Demographics Similar to Celtics and Bhutanese by Unemployment Among Ages 20 to 24 years
In terms of unemployment among ages 20 to 24 years, the demographic groups most similar to Celtics are Bolivian (9.9%, a difference of 0.040%), Kenyan (9.9%, a difference of 0.18%), Immigrants from Laos (9.9%, a difference of 0.21%), Immigrants from Australia (9.9%, a difference of 0.28%), and Czechoslovakian (9.9%, a difference of 0.37%). Similarly, the demographic groups most similar to Bhutanese are Macedonian (10.0%, a difference of 0.030%), Chilean (10.0%, a difference of 0.030%), Polish (10.0%, a difference of 0.050%), Immigrants from Oceania (10.0%, a difference of 0.14%), and Immigrants from Vietnam (10.0%, a difference of 0.18%).
| Demographics | Rating | Rank | Unemployment Among Ages 20 to 24 years |
| Celtics | 98.9 /100 | #71 | Exceptional 9.9% |
| Bolivians | 98.9 /100 | #72 | Exceptional 9.9% |
| Kenyans | 98.7 /100 | #73 | Exceptional 9.9% |
| Immigrants | Laos | 98.7 /100 | #74 | Exceptional 9.9% |
| Immigrants | Australia | 98.6 /100 | #75 | Exceptional 9.9% |
| Czechoslovakians | 98.4 /100 | #76 | Exceptional 9.9% |
| Chickasaw | 98.4 /100 | #77 | Exceptional 9.9% |
| Assyrians/Chaldeans/Syriacs | 98.3 /100 | #78 | Exceptional 9.9% |
| Icelanders | 98.3 /100 | #79 | Exceptional 9.9% |
| Immigrants | Netherlands | 98.2 /100 | #80 | Exceptional 9.9% |
| Yaqui | 98.0 /100 | #81 | Exceptional 9.9% |
| Sri Lankans | 98.0 /100 | #82 | Exceptional 9.9% |
| Immigrants | Bulgaria | 98.0 /100 | #83 | Exceptional 9.9% |
| Latvians | 97.9 /100 | #84 | Exceptional 9.9% |
| New Zealanders | 97.8 /100 | #85 | Exceptional 9.9% |
| Immigrants | Vietnam | 97.5 /100 | #86 | Exceptional 10.0% |
| Immigrants | Oceania | 97.4 /100 | #87 | Exceptional 10.0% |
| Poles | 97.1 /100 | #88 | Exceptional 10.0% |
| Macedonians | 97.0 /100 | #89 | Exceptional 10.0% |
| Chileans | 97.0 /100 | #90 | Exceptional 10.0% |
| Bhutanese | 96.9 /100 | #91 | Exceptional 10.0% |