Alsatian vs Indonesian Unemployment Among Ages 25 to 29 years
COMPARE
Alsatian
Indonesian
Unemployment Among Ages 25 to 29 years
Unemployment Among Ages 25 to 29 years Comparison
Alsatians
Indonesians
6.7%
UNEMPLOYMENT AMONG AGES 25 TO 29 YEARS
28.1/ 100
METRIC RATING
193rd/ 347
METRIC RANK
6.1%
UNEMPLOYMENT AMONG AGES 25 TO 29 YEARS
99.3/ 100
METRIC RATING
39th/ 347
METRIC RANK
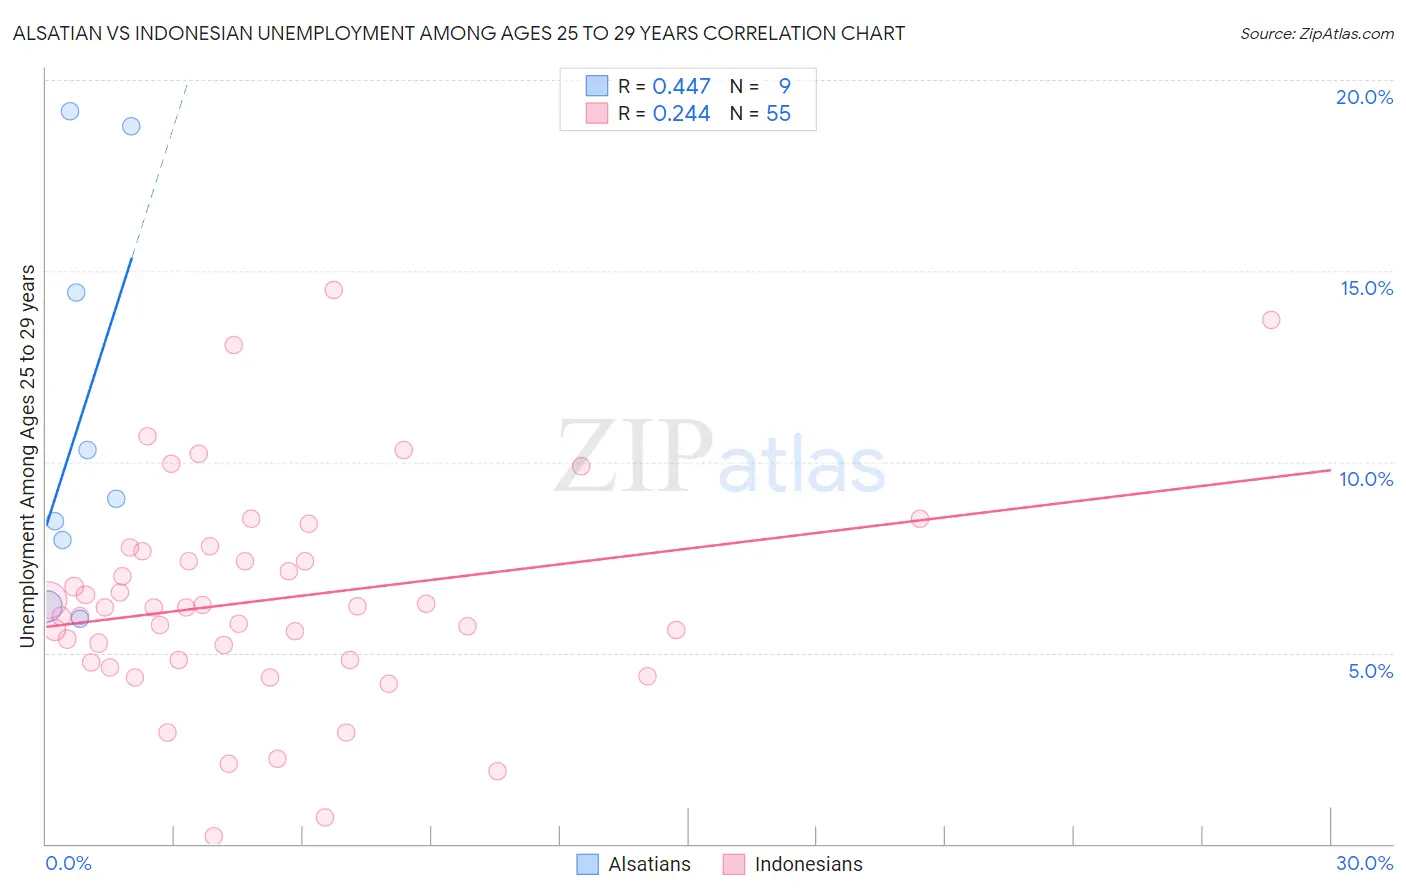
Alsatian vs Indonesian Unemployment Among Ages 25 to 29 years Correlation Chart
The statistical analysis conducted on geographies consisting of 80,994,703 people shows a moderate positive correlation between the proportion of Alsatians and unemployment rate among population between the ages 25 and 29 in the United States with a correlation coefficient (R) of 0.447 and weighted average of 6.7%. Similarly, the statistical analysis conducted on geographies consisting of 160,246,641 people shows a weak positive correlation between the proportion of Indonesians and unemployment rate among population between the ages 25 and 29 in the United States with a correlation coefficient (R) of 0.244 and weighted average of 6.1%, a difference of 9.9%.
Unemployment Among Ages 25 to 29 years Correlation Summary
| Measurement | Alsatian | Indonesian |
| Minimum | 5.9% | 0.20% |
| Maximum | 19.2% | 14.5% |
| Range | 13.3% | 14.3% |
| Mean | 11.1% | 6.4% |
| Median | 9.0% | 6.2% |
| Interquartile 25% (IQ1) | 7.1% | 4.8% |
| Interquartile 75% (IQ3) | 16.6% | 7.6% |
| Interquartile Range (IQR) | 9.5% | 2.8% |
| Standard Deviation (Sample) | 5.1% | 2.9% |
| Standard Deviation (Population) | 4.8% | 2.8% |
Similar Demographics by Unemployment Among Ages 25 to 29 years
Demographics Similar to Alsatians by Unemployment Among Ages 25 to 29 years
In terms of unemployment among ages 25 to 29 years, the demographic groups most similar to Alsatians are Immigrants from Greece (6.7%, a difference of 0.0%), Immigrants from Ukraine (6.7%, a difference of 0.040%), Chickasaw (6.7%, a difference of 0.050%), Immigrants from Western Asia (6.7%, a difference of 0.060%), and Korean (6.7%, a difference of 0.090%).
| Demographics | Rating | Rank | Unemployment Among Ages 25 to 29 years |
| Immigrants | Iran | 34.4 /100 | #186 | Fair 6.7% |
| Immigrants | South America | 33.0 /100 | #187 | Fair 6.7% |
| Irish | 32.8 /100 | #188 | Fair 6.7% |
| Argentineans | 32.1 /100 | #189 | Fair 6.7% |
| Koreans | 29.3 /100 | #190 | Fair 6.7% |
| Chickasaw | 28.7 /100 | #191 | Fair 6.7% |
| Immigrants | Ukraine | 28.6 /100 | #192 | Fair 6.7% |
| Alsatians | 28.1 /100 | #193 | Fair 6.7% |
| Immigrants | Greece | 28.0 /100 | #194 | Fair 6.7% |
| Immigrants | Western Asia | 27.3 /100 | #195 | Fair 6.7% |
| Hungarians | 26.8 /100 | #196 | Fair 6.8% |
| Italians | 26.5 /100 | #197 | Fair 6.8% |
| Immigrants | Southern Europe | 24.6 /100 | #198 | Fair 6.8% |
| Guamanians/Chamorros | 24.3 /100 | #199 | Fair 6.8% |
| South American Indians | 23.3 /100 | #200 | Fair 6.8% |
Demographics Similar to Indonesians by Unemployment Among Ages 25 to 29 years
In terms of unemployment among ages 25 to 29 years, the demographic groups most similar to Indonesians are Immigrants from Kenya (6.1%, a difference of 0.13%), Fijian (6.1%, a difference of 0.17%), Ethiopian (6.1%, a difference of 0.20%), Jordanian (6.1%, a difference of 0.20%), and Immigrants from Serbia (6.1%, a difference of 0.33%).
| Demographics | Rating | Rank | Unemployment Among Ages 25 to 29 years |
| Chinese | 99.6 /100 | #32 | Exceptional 6.1% |
| Yugoslavians | 99.6 /100 | #33 | Exceptional 6.1% |
| Immigrants | Morocco | 99.5 /100 | #34 | Exceptional 6.1% |
| Immigrants | Zimbabwe | 99.5 /100 | #35 | Exceptional 6.1% |
| Taiwanese | 99.5 /100 | #36 | Exceptional 6.1% |
| Immigrants | Serbia | 99.5 /100 | #37 | Exceptional 6.1% |
| Ethiopians | 99.4 /100 | #38 | Exceptional 6.1% |
| Indonesians | 99.3 /100 | #39 | Exceptional 6.1% |
| Immigrants | Kenya | 99.3 /100 | #40 | Exceptional 6.1% |
| Fijians | 99.3 /100 | #41 | Exceptional 6.1% |
| Jordanians | 99.3 /100 | #42 | Exceptional 6.1% |
| Czechs | 99.2 /100 | #43 | Exceptional 6.2% |
| Mongolians | 99.2 /100 | #44 | Exceptional 6.2% |
| Venezuelans | 99.1 /100 | #45 | Exceptional 6.2% |
| Immigrants | Lithuania | 99.0 /100 | #46 | Exceptional 6.2% |