Austrian vs Indonesian Male Unemployment
COMPARE
Austrian
Indonesian
Male Unemployment
Male Unemployment Comparison
Austrians
Indonesians
4.9%
MALE UNEMPLOYMENT
98.9/ 100
METRIC RATING
47th/ 347
METRIC RANK
5.2%
MALE UNEMPLOYMENT
71.2/ 100
METRIC RATING
159th/ 347
METRIC RANK
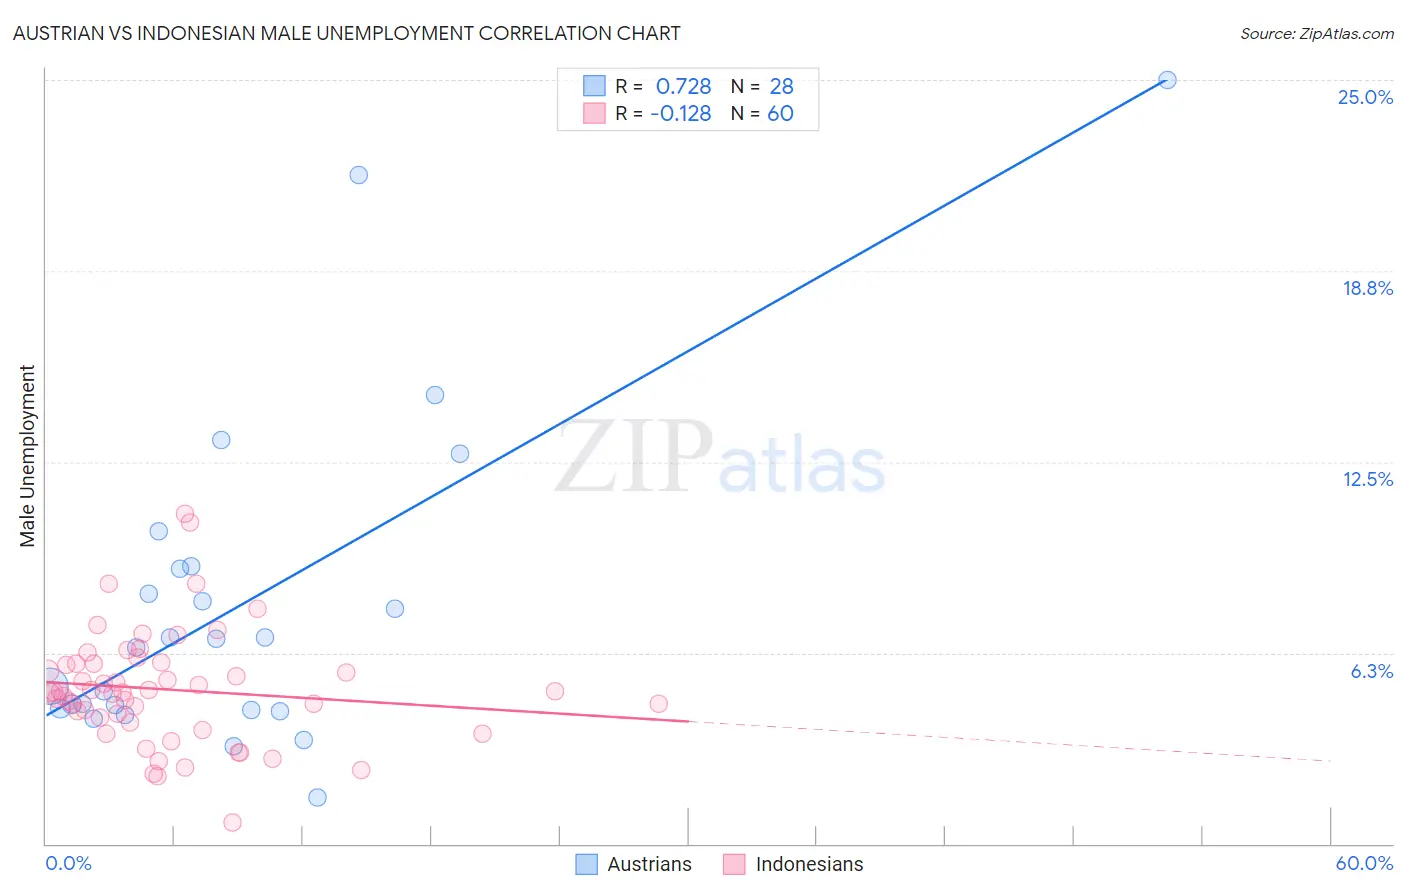
Austrian vs Indonesian Male Unemployment Correlation Chart
The statistical analysis conducted on geographies consisting of 448,962,183 people shows a strong positive correlation between the proportion of Austrians and unemployment rate among males in the United States with a correlation coefficient (R) of 0.728 and weighted average of 4.9%. Similarly, the statistical analysis conducted on geographies consisting of 162,567,478 people shows a poor negative correlation between the proportion of Indonesians and unemployment rate among males in the United States with a correlation coefficient (R) of -0.128 and weighted average of 5.2%, a difference of 5.6%.
Male Unemployment Correlation Summary
| Measurement | Austrian | Indonesian |
| Minimum | 1.5% | 0.70% |
| Maximum | 25.0% | 10.8% |
| Range | 23.5% | 10.1% |
| Mean | 7.8% | 5.0% |
| Median | 6.6% | 5.0% |
| Interquartile 25% (IQ1) | 4.4% | 4.0% |
| Interquartile 75% (IQ3) | 9.0% | 5.9% |
| Interquartile Range (IQR) | 4.6% | 1.8% |
| Standard Deviation (Sample) | 5.4% | 1.9% |
| Standard Deviation (Population) | 5.3% | 1.8% |
Similar Demographics by Male Unemployment
Demographics Similar to Austrians by Male Unemployment
In terms of male unemployment, the demographic groups most similar to Austrians are Immigrants from Scotland (4.9%, a difference of 0.020%), Polish (4.9%, a difference of 0.030%), Croatian (4.9%, a difference of 0.040%), Bhutanese (4.9%, a difference of 0.070%), and Slovene (5.0%, a difference of 0.070%).
| Demographics | Rating | Rank | Male Unemployment |
| Northern Europeans | 99.3 /100 | #40 | Exceptional 4.9% |
| Chinese | 99.3 /100 | #41 | Exceptional 4.9% |
| Immigrants | Belgium | 99.2 /100 | #42 | Exceptional 4.9% |
| Immigrants | Japan | 99.2 /100 | #43 | Exceptional 4.9% |
| Immigrants | Korea | 99.1 /100 | #44 | Exceptional 4.9% |
| Immigrants | Zimbabwe | 99.0 /100 | #45 | Exceptional 4.9% |
| Bhutanese | 98.9 /100 | #46 | Exceptional 4.9% |
| Austrians | 98.9 /100 | #47 | Exceptional 4.9% |
| Immigrants | Scotland | 98.9 /100 | #48 | Exceptional 4.9% |
| Poles | 98.9 /100 | #49 | Exceptional 4.9% |
| Croatians | 98.9 /100 | #50 | Exceptional 4.9% |
| Slovenes | 98.8 /100 | #51 | Exceptional 5.0% |
| Irish | 98.8 /100 | #52 | Exceptional 5.0% |
| Jordanians | 98.8 /100 | #53 | Exceptional 5.0% |
| Yugoslavians | 98.7 /100 | #54 | Exceptional 5.0% |
Demographics Similar to Indonesians by Male Unemployment
In terms of male unemployment, the demographic groups most similar to Indonesians are Immigrants from Norway (5.2%, a difference of 0.010%), Immigrants from Indonesia (5.2%, a difference of 0.030%), Immigrants from China (5.2%, a difference of 0.040%), Immigrants from Northern Africa (5.2%, a difference of 0.080%), and American (5.2%, a difference of 0.11%).
| Demographics | Rating | Rank | Male Unemployment |
| Egyptians | 74.8 /100 | #152 | Good 5.2% |
| Immigrants | Uruguay | 73.9 /100 | #153 | Good 5.2% |
| Laotians | 73.8 /100 | #154 | Good 5.2% |
| Immigrants | Hungary | 73.4 /100 | #155 | Good 5.2% |
| Americans | 72.7 /100 | #156 | Good 5.2% |
| Immigrants | Northern Africa | 72.3 /100 | #157 | Good 5.2% |
| Immigrants | Indonesia | 71.5 /100 | #158 | Good 5.2% |
| Indonesians | 71.2 /100 | #159 | Good 5.2% |
| Immigrants | Norway | 71.0 /100 | #160 | Good 5.2% |
| Immigrants | China | 70.6 /100 | #161 | Good 5.2% |
| Immigrants | Egypt | 65.9 /100 | #162 | Good 5.2% |
| Immigrants | Hong Kong | 65.7 /100 | #163 | Good 5.2% |
| Afghans | 62.0 /100 | #164 | Good 5.3% |
| South Americans | 60.6 /100 | #165 | Good 5.3% |
| Immigrants | Morocco | 60.2 /100 | #166 | Good 5.3% |