Aleut vs New Zealander Unemployment
COMPARE
Aleut
New Zealander
Unemployment
Unemployment Comparison
Aleuts
New Zealanders
6.1%
UNEMPLOYMENT
0.0/ 100
METRIC RATING
284th/ 347
METRIC RANK
4.9%
UNEMPLOYMENT
98.6/ 100
METRIC RATING
67th/ 347
METRIC RANK
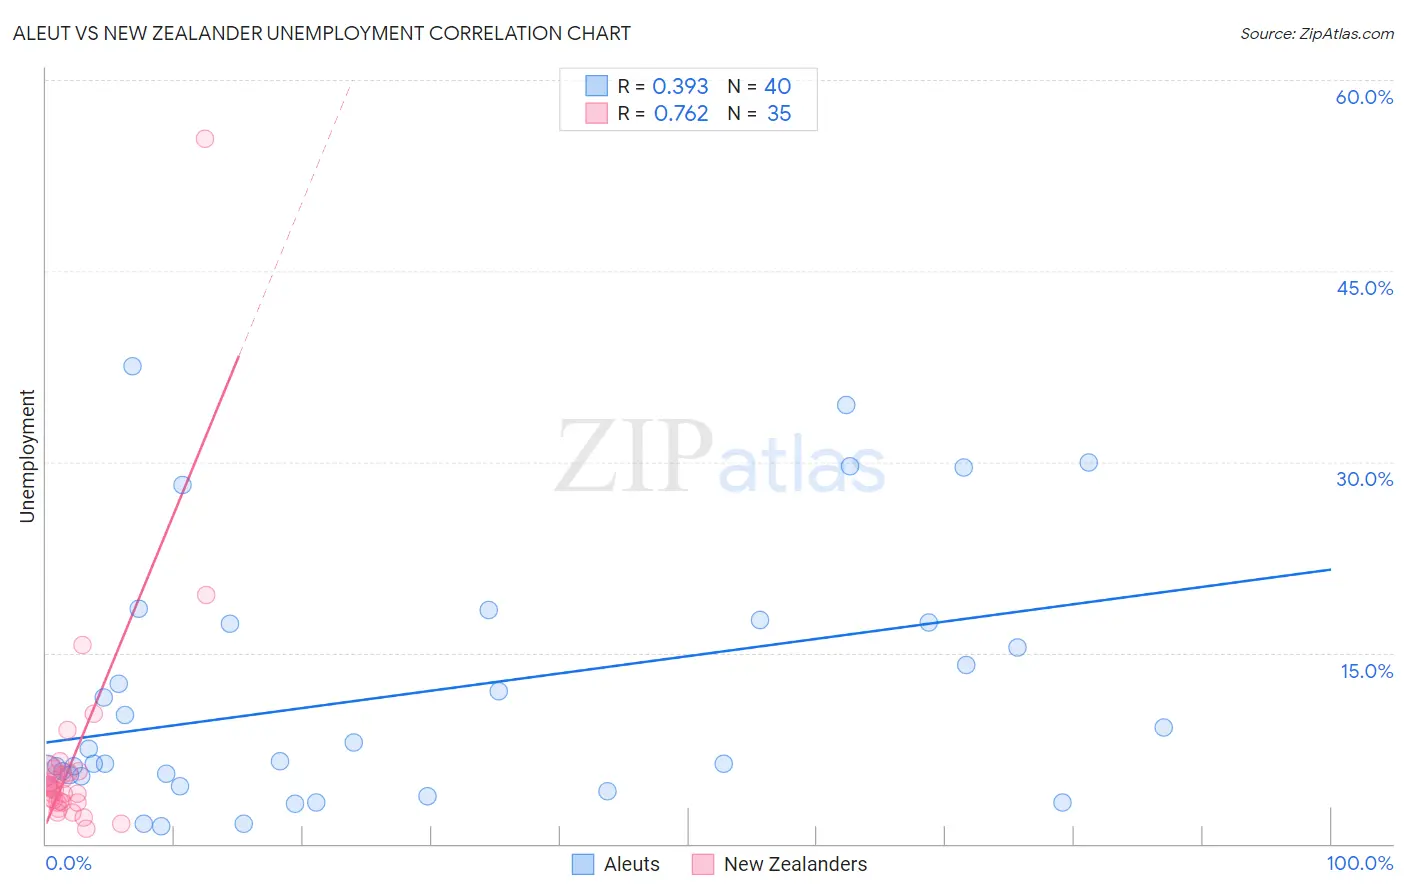
Aleut vs New Zealander Unemployment Correlation Chart
The statistical analysis conducted on geographies consisting of 61,764,375 people shows a mild positive correlation between the proportion of Aleuts and unemployment in the United States with a correlation coefficient (R) of 0.393 and weighted average of 6.1%. Similarly, the statistical analysis conducted on geographies consisting of 106,884,587 people shows a strong positive correlation between the proportion of New Zealanders and unemployment in the United States with a correlation coefficient (R) of 0.762 and weighted average of 4.9%, a difference of 23.6%.
Unemployment Correlation Summary
| Measurement | Aleut | New Zealander |
| Minimum | 1.4% | 1.2% |
| Maximum | 37.5% | 55.4% |
| Range | 36.1% | 54.2% |
| Mean | 11.8% | 6.6% |
| Median | 7.0% | 4.4% |
| Interquartile 25% (IQ1) | 5.4% | 3.3% |
| Interquartile 75% (IQ3) | 17.4% | 5.6% |
| Interquartile Range (IQR) | 12.0% | 2.3% |
| Standard Deviation (Sample) | 9.8% | 9.2% |
| Standard Deviation (Population) | 9.7% | 9.1% |
Similar Demographics by Unemployment
Demographics Similar to Aleuts by Unemployment
In terms of unemployment, the demographic groups most similar to Aleuts are Immigrants from Ghana (6.1%, a difference of 0.13%), Immigrants from the Azores (6.1%, a difference of 0.21%), African (6.1%, a difference of 0.28%), Immigrants from Mexico (6.0%, a difference of 0.86%), and Immigrants from Western Africa (6.0%, a difference of 0.86%).
| Demographics | Rating | Rank | Unemployment |
| Armenians | 0.0 /100 | #277 | Tragic 6.0% |
| Ghanaians | 0.0 /100 | #278 | Tragic 6.0% |
| Immigrants | Mexico | 0.0 /100 | #279 | Tragic 6.0% |
| Immigrants | Western Africa | 0.0 /100 | #280 | Tragic 6.0% |
| Africans | 0.0 /100 | #281 | Tragic 6.1% |
| Immigrants | Azores | 0.0 /100 | #282 | Tragic 6.1% |
| Immigrants | Ghana | 0.0 /100 | #283 | Tragic 6.1% |
| Aleuts | 0.0 /100 | #284 | Tragic 6.1% |
| Immigrants | Senegal | 0.0 /100 | #285 | Tragic 6.1% |
| Immigrants | Caribbean | 0.0 /100 | #286 | Tragic 6.2% |
| Nepalese | 0.0 /100 | #287 | Tragic 6.2% |
| Ecuadorians | 0.0 /100 | #288 | Tragic 6.2% |
| Chippewa | 0.0 /100 | #289 | Tragic 6.2% |
| Senegalese | 0.0 /100 | #290 | Tragic 6.2% |
| Haitians | 0.0 /100 | #291 | Tragic 6.2% |
Demographics Similar to New Zealanders by Unemployment
In terms of unemployment, the demographic groups most similar to New Zealanders are Slavic (4.9%, a difference of 0.030%), Slovak (4.9%, a difference of 0.040%), Immigrants from North America (4.9%, a difference of 0.12%), Immigrants from Canada (4.9%, a difference of 0.19%), and Serbian (4.9%, a difference of 0.27%).
| Demographics | Rating | Rank | Unemployment |
| Immigrants | Netherlands | 99.0 /100 | #60 | Exceptional 4.9% |
| Cambodians | 99.0 /100 | #61 | Exceptional 4.9% |
| Icelanders | 98.9 /100 | #62 | Exceptional 4.9% |
| Immigrants | Bulgaria | 98.9 /100 | #63 | Exceptional 4.9% |
| Italians | 98.9 /100 | #64 | Exceptional 4.9% |
| Immigrants | Canada | 98.8 /100 | #65 | Exceptional 4.9% |
| Slovaks | 98.7 /100 | #66 | Exceptional 4.9% |
| New Zealanders | 98.6 /100 | #67 | Exceptional 4.9% |
| Slavs | 98.6 /100 | #68 | Exceptional 4.9% |
| Immigrants | North America | 98.5 /100 | #69 | Exceptional 4.9% |
| Serbians | 98.4 /100 | #70 | Exceptional 4.9% |
| Immigrants | Japan | 98.3 /100 | #71 | Exceptional 4.9% |
| Burmese | 98.3 /100 | #72 | Exceptional 4.9% |
| Paraguayans | 98.3 /100 | #73 | Exceptional 4.9% |
| Immigrants | Northern Europe | 98.2 /100 | #74 | Exceptional 4.9% |