Aleut vs New Zealander Unemployment Among Seniors over 75 years
COMPARE
Aleut
New Zealander
Unemployment Among Seniors over 75 years
Unemployment Among Seniors over 75 years Comparison
Aleuts
New Zealanders
10.3%
UNEMPLOYMENT AMONG SENIORS OVER 75 YEARS
0.0/ 100
METRIC RATING
321st/ 347
METRIC RANK
8.1%
UNEMPLOYMENT AMONG SENIORS OVER 75 YEARS
99.5/ 100
METRIC RATING
88th/ 347
METRIC RANK
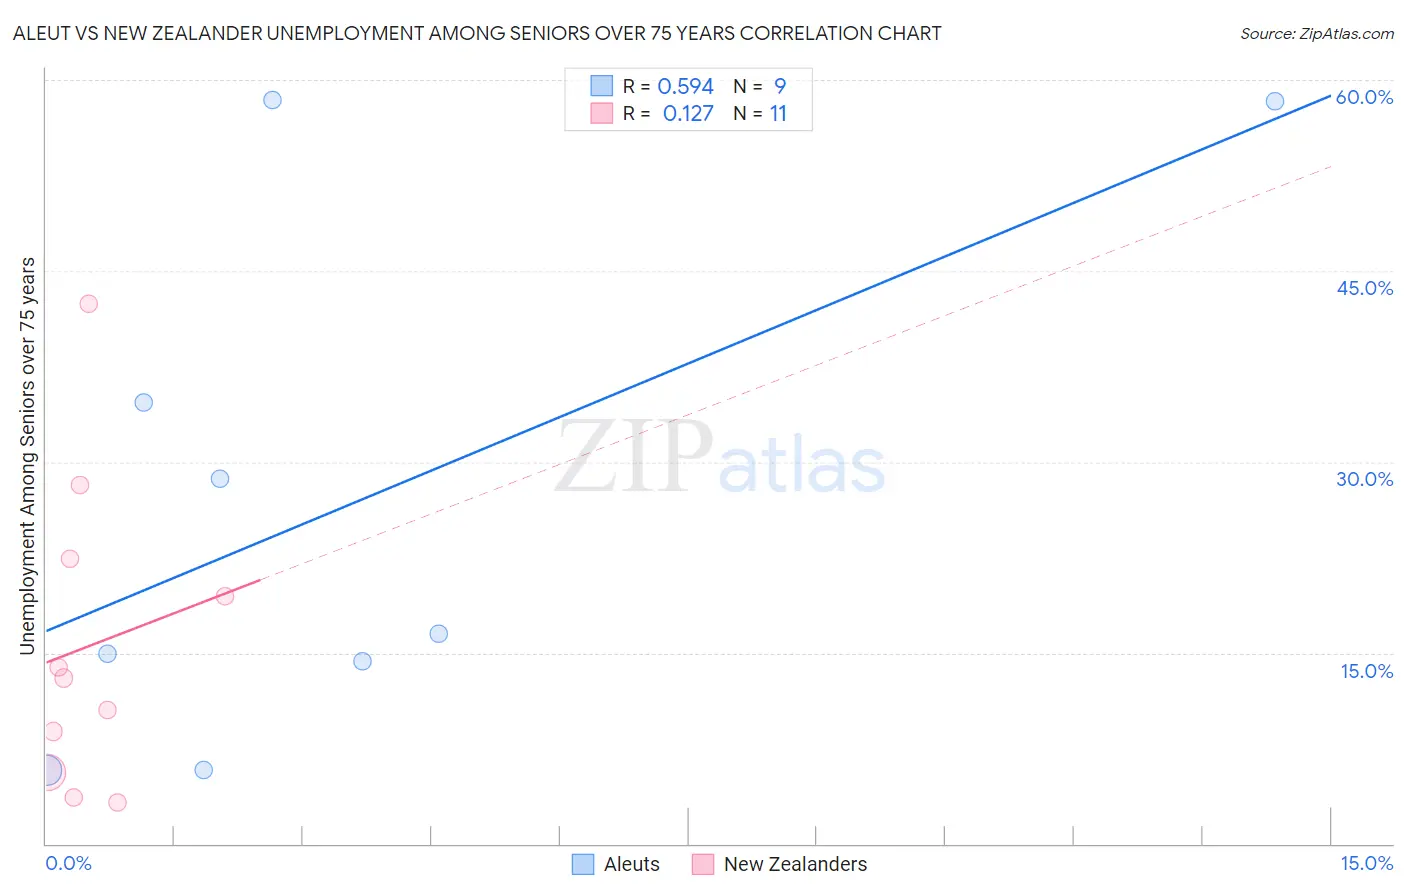
Aleut vs New Zealander Unemployment Among Seniors over 75 years Correlation Chart
The statistical analysis conducted on geographies consisting of 49,450,767 people shows a substantial positive correlation between the proportion of Aleuts and unemployment rate among seniors over the age of 75 in the United States with a correlation coefficient (R) of 0.594 and weighted average of 10.3%. Similarly, the statistical analysis conducted on geographies consisting of 82,204,458 people shows a poor positive correlation between the proportion of New Zealanders and unemployment rate among seniors over the age of 75 in the United States with a correlation coefficient (R) of 0.127 and weighted average of 8.1%, a difference of 26.6%.
Unemployment Among Seniors over 75 years Correlation Summary
| Measurement | Aleut | New Zealander |
| Minimum | 5.8% | 3.2% |
| Maximum | 58.4% | 42.5% |
| Range | 52.6% | 39.3% |
| Mean | 26.4% | 15.6% |
| Median | 16.5% | 13.0% |
| Interquartile 25% (IQ1) | 10.0% | 5.6% |
| Interquartile 75% (IQ3) | 46.5% | 22.4% |
| Interquartile Range (IQR) | 36.4% | 16.8% |
| Standard Deviation (Sample) | 20.4% | 11.9% |
| Standard Deviation (Population) | 19.3% | 11.4% |
Similar Demographics by Unemployment Among Seniors over 75 years
Demographics Similar to Aleuts by Unemployment Among Seniors over 75 years
In terms of unemployment among seniors over 75 years, the demographic groups most similar to Aleuts are French (10.3%, a difference of 0.010%), German (10.3%, a difference of 0.23%), Liberian (10.2%, a difference of 0.31%), Polish (10.3%, a difference of 0.35%), and Irish (10.2%, a difference of 0.43%).
| Demographics | Rating | Rank | Unemployment Among Seniors over 75 years |
| Dutch West Indians | 0.0 /100 | #314 | Tragic 10.2% |
| Pennsylvania Germans | 0.0 /100 | #315 | Tragic 10.2% |
| Natives/Alaskans | 0.0 /100 | #316 | Tragic 10.2% |
| Irish | 0.0 /100 | #317 | Tragic 10.2% |
| Liberians | 0.0 /100 | #318 | Tragic 10.2% |
| Germans | 0.0 /100 | #319 | Tragic 10.3% |
| French | 0.0 /100 | #320 | Tragic 10.3% |
| Aleuts | 0.0 /100 | #321 | Tragic 10.3% |
| Poles | 0.0 /100 | #322 | Tragic 10.3% |
| Tongans | 0.0 /100 | #323 | Tragic 10.4% |
| Americans | 0.0 /100 | #324 | Tragic 10.4% |
| Portuguese | 0.0 /100 | #325 | Tragic 10.4% |
| Slovaks | 0.0 /100 | #326 | Tragic 10.4% |
| Dutch | 0.0 /100 | #327 | Tragic 10.4% |
| Immigrants | Portugal | 0.0 /100 | #328 | Tragic 10.5% |
Demographics Similar to New Zealanders by Unemployment Among Seniors over 75 years
In terms of unemployment among seniors over 75 years, the demographic groups most similar to New Zealanders are Immigrants from Korea (8.1%, a difference of 0.010%), Basque (8.1%, a difference of 0.040%), Immigrants from Vietnam (8.1%, a difference of 0.090%), Egyptian (8.1%, a difference of 0.13%), and Venezuelan (8.1%, a difference of 0.13%).
| Demographics | Rating | Rank | Unemployment Among Seniors over 75 years |
| Cubans | 99.7 /100 | #81 | Exceptional 8.0% |
| Bhutanese | 99.7 /100 | #82 | Exceptional 8.0% |
| Arapaho | 99.7 /100 | #83 | Exceptional 8.1% |
| U.S. Virgin Islanders | 99.7 /100 | #84 | Exceptional 8.1% |
| Immigrants | Indonesia | 99.7 /100 | #85 | Exceptional 8.1% |
| Immigrants | Singapore | 99.7 /100 | #86 | Exceptional 8.1% |
| Basques | 99.5 /100 | #87 | Exceptional 8.1% |
| New Zealanders | 99.5 /100 | #88 | Exceptional 8.1% |
| Immigrants | Korea | 99.5 /100 | #89 | Exceptional 8.1% |
| Immigrants | Vietnam | 99.5 /100 | #90 | Exceptional 8.1% |
| Egyptians | 99.5 /100 | #91 | Exceptional 8.1% |
| Venezuelans | 99.5 /100 | #92 | Exceptional 8.1% |
| Immigrants | Netherlands | 99.5 /100 | #93 | Exceptional 8.1% |
| Immigrants | Ireland | 99.4 /100 | #94 | Exceptional 8.1% |
| Nicaraguans | 99.3 /100 | #95 | Exceptional 8.2% |