Jordanian vs New Zealander Unemployment
COMPARE
Jordanian
New Zealander
Unemployment
Unemployment Comparison
Jordanians
New Zealanders
5.0%
UNEMPLOYMENT
96.4/ 100
METRIC RATING
89th/ 347
METRIC RANK
4.9%
UNEMPLOYMENT
98.6/ 100
METRIC RATING
67th/ 347
METRIC RANK
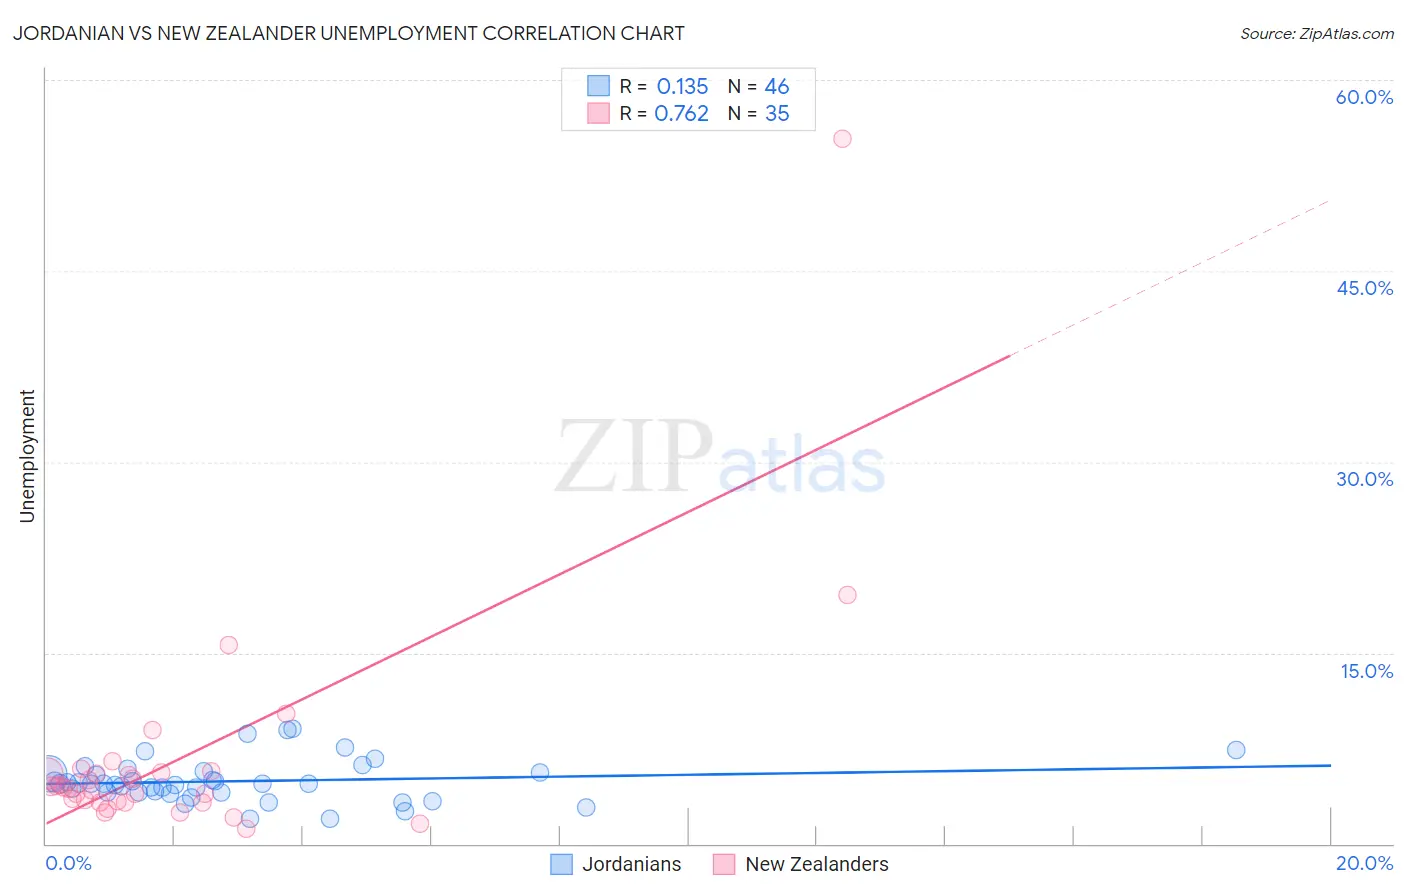
Jordanian vs New Zealander Unemployment Correlation Chart
The statistical analysis conducted on geographies consisting of 166,387,098 people shows a poor positive correlation between the proportion of Jordanians and unemployment in the United States with a correlation coefficient (R) of 0.135 and weighted average of 5.0%. Similarly, the statistical analysis conducted on geographies consisting of 106,884,587 people shows a strong positive correlation between the proportion of New Zealanders and unemployment in the United States with a correlation coefficient (R) of 0.762 and weighted average of 4.9%, a difference of 1.6%.
Unemployment Correlation Summary
| Measurement | Jordanian | New Zealander |
| Minimum | 2.0% | 1.2% |
| Maximum | 9.0% | 55.4% |
| Range | 7.0% | 54.2% |
| Mean | 4.9% | 6.6% |
| Median | 4.7% | 4.4% |
| Interquartile 25% (IQ1) | 4.1% | 3.3% |
| Interquartile 75% (IQ3) | 5.6% | 5.6% |
| Interquartile Range (IQR) | 1.5% | 2.3% |
| Standard Deviation (Sample) | 1.6% | 9.2% |
| Standard Deviation (Population) | 1.6% | 9.1% |
Similar Demographics by Unemployment
Demographics Similar to Jordanians by Unemployment
In terms of unemployment, the demographic groups most similar to Jordanians are Immigrants from North Macedonia (5.0%, a difference of 0.040%), Immigrants from Sudan (5.0%, a difference of 0.050%), Immigrants from South Africa (5.0%, a difference of 0.070%), Immigrants from Korea (5.0%, a difference of 0.090%), and Immigrants from Moldova (5.0%, a difference of 0.12%).
| Demographics | Rating | Rank | Unemployment |
| Fijians | 97.6 /100 | #82 | Exceptional 5.0% |
| Hmong | 97.6 /100 | #83 | Exceptional 5.0% |
| Russians | 97.4 /100 | #84 | Exceptional 5.0% |
| Immigrants | Australia | 97.0 /100 | #85 | Exceptional 5.0% |
| Hungarians | 96.9 /100 | #86 | Exceptional 5.0% |
| Immigrants | Moldova | 96.6 /100 | #87 | Exceptional 5.0% |
| Immigrants | Korea | 96.6 /100 | #88 | Exceptional 5.0% |
| Jordanians | 96.4 /100 | #89 | Exceptional 5.0% |
| Immigrants | North Macedonia | 96.3 /100 | #90 | Exceptional 5.0% |
| Immigrants | Sudan | 96.3 /100 | #91 | Exceptional 5.0% |
| Immigrants | South Africa | 96.2 /100 | #92 | Exceptional 5.0% |
| Ukrainians | 96.0 /100 | #93 | Exceptional 5.0% |
| Immigrants | Austria | 95.9 /100 | #94 | Exceptional 5.0% |
| Immigrants | Serbia | 95.6 /100 | #95 | Exceptional 5.0% |
| Immigrants | England | 95.2 /100 | #96 | Exceptional 5.0% |
Demographics Similar to New Zealanders by Unemployment
In terms of unemployment, the demographic groups most similar to New Zealanders are Slavic (4.9%, a difference of 0.030%), Slovak (4.9%, a difference of 0.040%), Immigrants from North America (4.9%, a difference of 0.12%), Immigrants from Canada (4.9%, a difference of 0.19%), and Serbian (4.9%, a difference of 0.27%).
| Demographics | Rating | Rank | Unemployment |
| Immigrants | Netherlands | 99.0 /100 | #60 | Exceptional 4.9% |
| Cambodians | 99.0 /100 | #61 | Exceptional 4.9% |
| Icelanders | 98.9 /100 | #62 | Exceptional 4.9% |
| Immigrants | Bulgaria | 98.9 /100 | #63 | Exceptional 4.9% |
| Italians | 98.9 /100 | #64 | Exceptional 4.9% |
| Immigrants | Canada | 98.8 /100 | #65 | Exceptional 4.9% |
| Slovaks | 98.7 /100 | #66 | Exceptional 4.9% |
| New Zealanders | 98.6 /100 | #67 | Exceptional 4.9% |
| Slavs | 98.6 /100 | #68 | Exceptional 4.9% |
| Immigrants | North America | 98.5 /100 | #69 | Exceptional 4.9% |
| Serbians | 98.4 /100 | #70 | Exceptional 4.9% |
| Immigrants | Japan | 98.3 /100 | #71 | Exceptional 4.9% |
| Burmese | 98.3 /100 | #72 | Exceptional 4.9% |
| Paraguayans | 98.3 /100 | #73 | Exceptional 4.9% |
| Immigrants | Northern Europe | 98.2 /100 | #74 | Exceptional 4.9% |