Aleut vs Tsimshian Unemployment Among Seniors over 75 years
COMPARE
Aleut
Tsimshian
Unemployment Among Seniors over 75 years
Unemployment Among Seniors over 75 years Comparison
Aleuts
Tsimshian
10.3%
UNEMPLOYMENT AMONG SENIORS OVER 75 YEARS
0.0/ 100
METRIC RATING
321st/ 347
METRIC RANK
10.5%
UNEMPLOYMENT AMONG SENIORS OVER 75 YEARS
0.0/ 100
METRIC RATING
329th/ 347
METRIC RANK
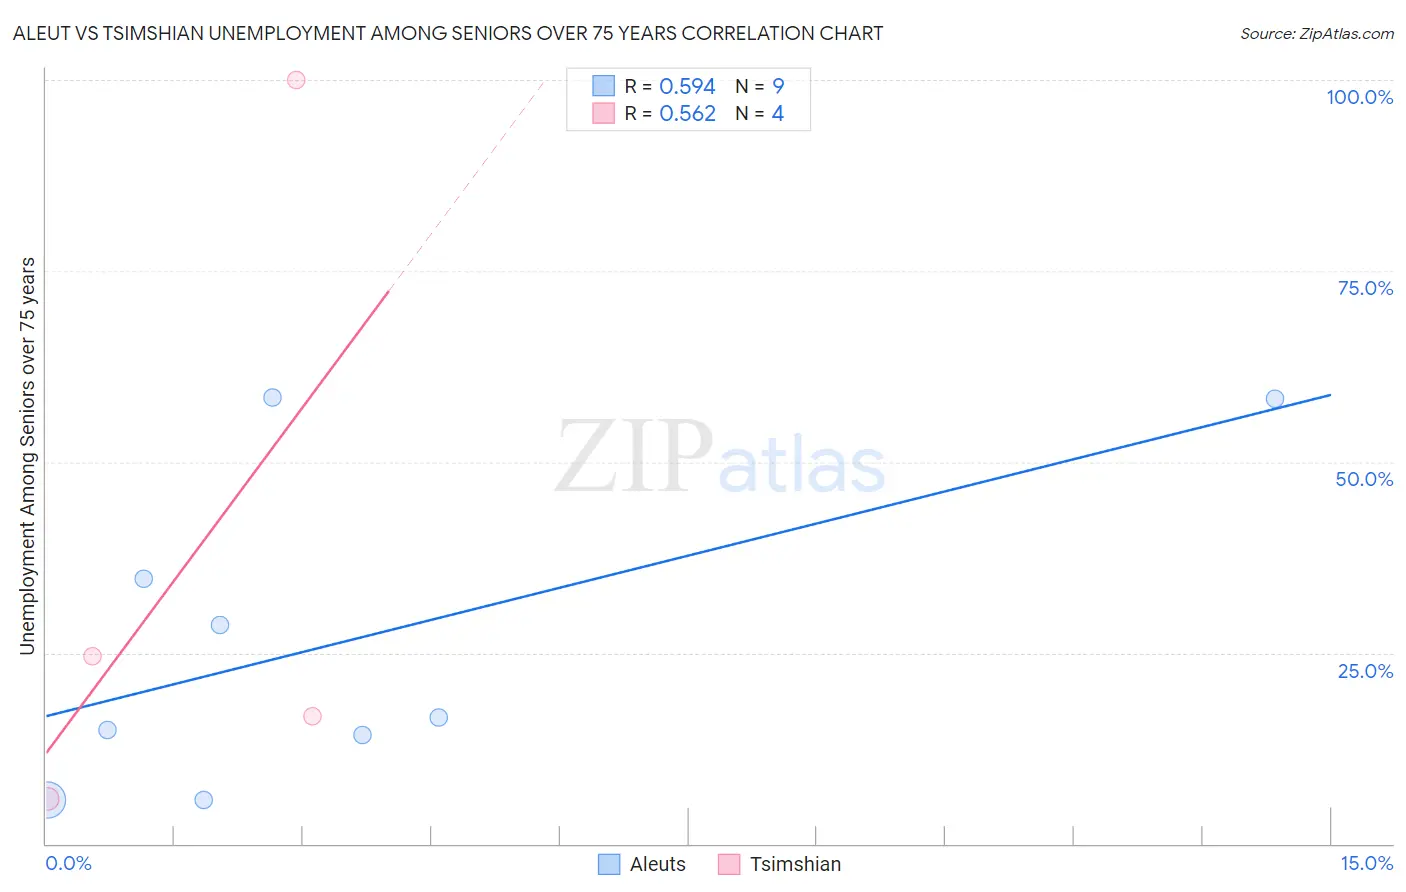
Aleut vs Tsimshian Unemployment Among Seniors over 75 years Correlation Chart
The statistical analysis conducted on geographies consisting of 49,450,767 people shows a substantial positive correlation between the proportion of Aleuts and unemployment rate among seniors over the age of 75 in the United States with a correlation coefficient (R) of 0.594 and weighted average of 10.3%. Similarly, the statistical analysis conducted on geographies consisting of 12,337,833 people shows a substantial positive correlation between the proportion of Tsimshian and unemployment rate among seniors over the age of 75 in the United States with a correlation coefficient (R) of 0.562 and weighted average of 10.5%, a difference of 2.5%.
Unemployment Among Seniors over 75 years Correlation Summary
| Measurement | Aleut | Tsimshian |
| Minimum | 5.8% | 5.9% |
| Maximum | 58.4% | 100.0% |
| Range | 52.6% | 94.1% |
| Mean | 26.4% | 36.8% |
| Median | 16.5% | 20.6% |
| Interquartile 25% (IQ1) | 10.0% | 11.3% |
| Interquartile 75% (IQ3) | 46.5% | 62.3% |
| Interquartile Range (IQR) | 36.4% | 51.0% |
| Standard Deviation (Sample) | 20.4% | 42.8% |
| Standard Deviation (Population) | 19.3% | 37.1% |
Demographics Similar to Aleuts and Tsimshian by Unemployment Among Seniors over 75 years
In terms of unemployment among seniors over 75 years, the demographic groups most similar to Aleuts are French (10.3%, a difference of 0.010%), German (10.3%, a difference of 0.23%), Liberian (10.2%, a difference of 0.31%), Polish (10.3%, a difference of 0.35%), and Irish (10.2%, a difference of 0.43%). Similarly, the demographic groups most similar to Tsimshian are Immigrants from Portugal (10.5%, a difference of 0.35%), Dutch (10.4%, a difference of 0.99%), Slovak (10.4%, a difference of 1.1%), Portuguese (10.4%, a difference of 1.3%), and American (10.4%, a difference of 1.5%).
| Demographics | Rating | Rank | Unemployment Among Seniors over 75 years |
| Pennsylvania Germans | 0.0 /100 | #315 | Tragic 10.2% |
| Natives/Alaskans | 0.0 /100 | #316 | Tragic 10.2% |
| Irish | 0.0 /100 | #317 | Tragic 10.2% |
| Liberians | 0.0 /100 | #318 | Tragic 10.2% |
| Germans | 0.0 /100 | #319 | Tragic 10.3% |
| French | 0.0 /100 | #320 | Tragic 10.3% |
| Aleuts | 0.0 /100 | #321 | Tragic 10.3% |
| Poles | 0.0 /100 | #322 | Tragic 10.3% |
| Tongans | 0.0 /100 | #323 | Tragic 10.4% |
| Americans | 0.0 /100 | #324 | Tragic 10.4% |
| Portuguese | 0.0 /100 | #325 | Tragic 10.4% |
| Slovaks | 0.0 /100 | #326 | Tragic 10.4% |
| Dutch | 0.0 /100 | #327 | Tragic 10.4% |
| Immigrants | Portugal | 0.0 /100 | #328 | Tragic 10.5% |
| Tsimshian | 0.0 /100 | #329 | Tragic 10.5% |
| Immigrants | Azores | 0.0 /100 | #330 | Tragic 10.7% |
| Tohono O'odham | 0.0 /100 | #331 | Tragic 10.8% |
| Immigrants | Liberia | 0.0 /100 | #332 | Tragic 10.9% |
| Alaskan Athabascans | 0.0 /100 | #333 | Tragic 11.0% |
| Assyrians/Chaldeans/Syriacs | 0.0 /100 | #334 | Tragic 11.1% |
| French Canadians | 0.0 /100 | #335 | Tragic 11.2% |