Aleut vs Serbian Unemployment Among Seniors over 75 years
COMPARE
Aleut
Serbian
Unemployment Among Seniors over 75 years
Unemployment Among Seniors over 75 years Comparison
Aleuts
Serbians
10.3%
UNEMPLOYMENT AMONG SENIORS OVER 75 YEARS
0.0/ 100
METRIC RATING
321st/ 347
METRIC RANK
8.4%
UNEMPLOYMENT AMONG SENIORS OVER 75 YEARS
93.7/ 100
METRIC RATING
133rd/ 347
METRIC RANK
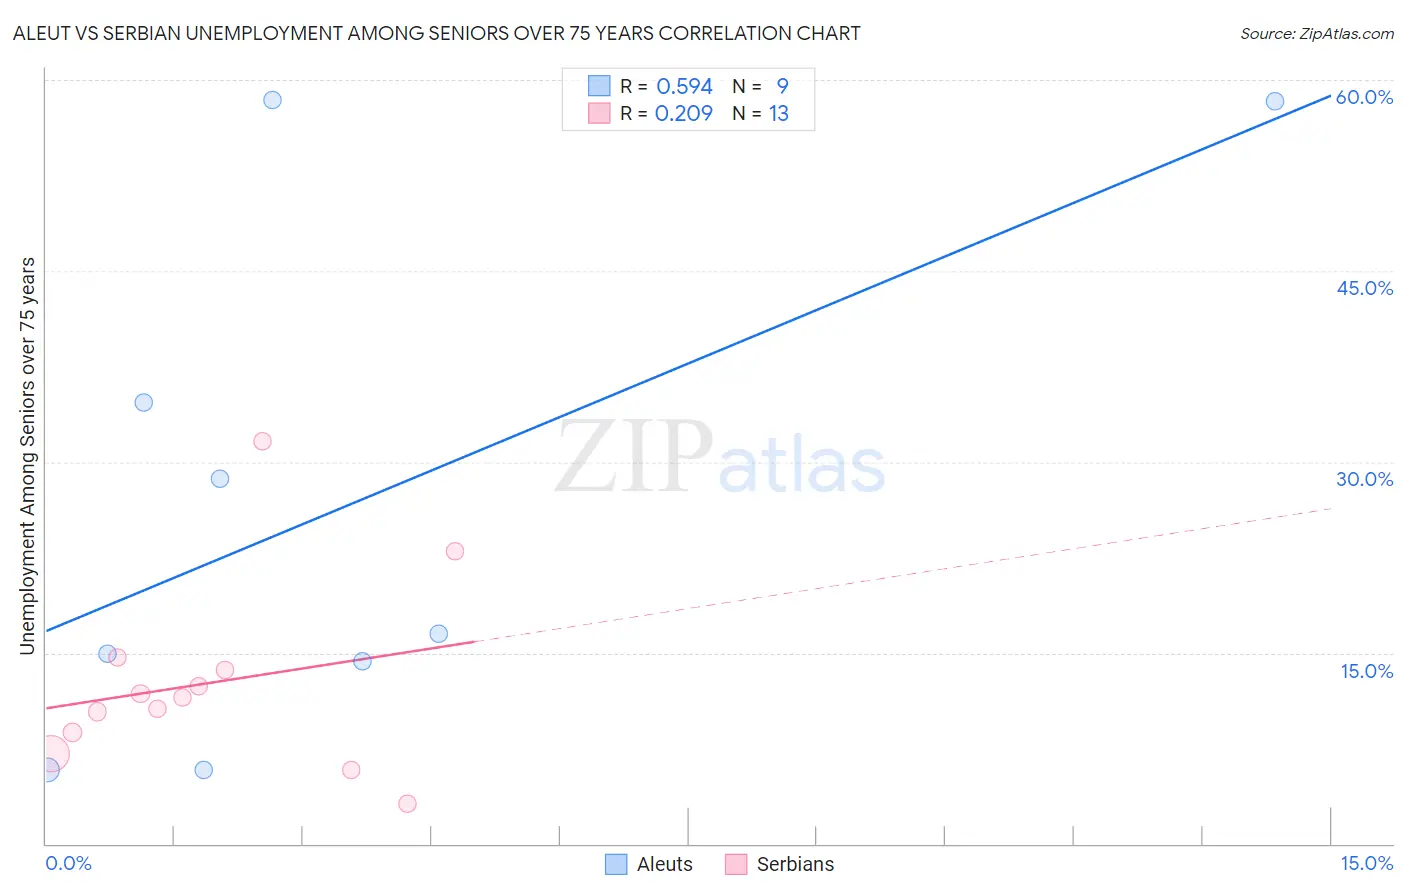
Aleut vs Serbian Unemployment Among Seniors over 75 years Correlation Chart
The statistical analysis conducted on geographies consisting of 49,450,767 people shows a substantial positive correlation between the proportion of Aleuts and unemployment rate among seniors over the age of 75 in the United States with a correlation coefficient (R) of 0.594 and weighted average of 10.3%. Similarly, the statistical analysis conducted on geographies consisting of 156,247,498 people shows a weak positive correlation between the proportion of Serbians and unemployment rate among seniors over the age of 75 in the United States with a correlation coefficient (R) of 0.209 and weighted average of 8.4%, a difference of 21.9%.
Unemployment Among Seniors over 75 years Correlation Summary
| Measurement | Aleut | Serbian |
| Minimum | 5.8% | 3.1% |
| Maximum | 58.4% | 31.6% |
| Range | 52.6% | 28.5% |
| Mean | 26.4% | 12.6% |
| Median | 16.5% | 11.5% |
| Interquartile 25% (IQ1) | 10.0% | 7.9% |
| Interquartile 75% (IQ3) | 46.5% | 14.1% |
| Interquartile Range (IQR) | 36.4% | 6.3% |
| Standard Deviation (Sample) | 20.4% | 7.5% |
| Standard Deviation (Population) | 19.3% | 7.2% |
Similar Demographics by Unemployment Among Seniors over 75 years
Demographics Similar to Aleuts by Unemployment Among Seniors over 75 years
In terms of unemployment among seniors over 75 years, the demographic groups most similar to Aleuts are French (10.3%, a difference of 0.010%), German (10.3%, a difference of 0.23%), Liberian (10.2%, a difference of 0.31%), Polish (10.3%, a difference of 0.35%), and Irish (10.2%, a difference of 0.43%).
| Demographics | Rating | Rank | Unemployment Among Seniors over 75 years |
| Dutch West Indians | 0.0 /100 | #314 | Tragic 10.2% |
| Pennsylvania Germans | 0.0 /100 | #315 | Tragic 10.2% |
| Natives/Alaskans | 0.0 /100 | #316 | Tragic 10.2% |
| Irish | 0.0 /100 | #317 | Tragic 10.2% |
| Liberians | 0.0 /100 | #318 | Tragic 10.2% |
| Germans | 0.0 /100 | #319 | Tragic 10.3% |
| French | 0.0 /100 | #320 | Tragic 10.3% |
| Aleuts | 0.0 /100 | #321 | Tragic 10.3% |
| Poles | 0.0 /100 | #322 | Tragic 10.3% |
| Tongans | 0.0 /100 | #323 | Tragic 10.4% |
| Americans | 0.0 /100 | #324 | Tragic 10.4% |
| Portuguese | 0.0 /100 | #325 | Tragic 10.4% |
| Slovaks | 0.0 /100 | #326 | Tragic 10.4% |
| Dutch | 0.0 /100 | #327 | Tragic 10.4% |
| Immigrants | Portugal | 0.0 /100 | #328 | Tragic 10.5% |
Demographics Similar to Serbians by Unemployment Among Seniors over 75 years
In terms of unemployment among seniors over 75 years, the demographic groups most similar to Serbians are Chilean (8.4%, a difference of 0.030%), Immigrants from Czechoslovakia (8.4%, a difference of 0.080%), German Russian (8.4%, a difference of 0.31%), Apache (8.4%, a difference of 0.39%), and Haitian (8.5%, a difference of 0.47%).
| Demographics | Rating | Rank | Unemployment Among Seniors over 75 years |
| Belizeans | 96.3 /100 | #126 | Exceptional 8.4% |
| Hondurans | 96.2 /100 | #127 | Exceptional 8.4% |
| Native Hawaiians | 96.1 /100 | #128 | Exceptional 8.4% |
| Ghanaians | 96.0 /100 | #129 | Exceptional 8.4% |
| Apache | 95.2 /100 | #130 | Exceptional 8.4% |
| German Russians | 94.9 /100 | #131 | Exceptional 8.4% |
| Chileans | 93.8 /100 | #132 | Exceptional 8.4% |
| Serbians | 93.7 /100 | #133 | Exceptional 8.4% |
| Immigrants | Czechoslovakia | 93.4 /100 | #134 | Exceptional 8.4% |
| Haitians | 91.4 /100 | #135 | Exceptional 8.5% |
| Immigrants | Trinidad and Tobago | 90.8 /100 | #136 | Exceptional 8.5% |
| Immigrants | Kuwait | 90.5 /100 | #137 | Exceptional 8.5% |
| Immigrants | Bulgaria | 89.6 /100 | #138 | Excellent 8.5% |
| Barbadians | 88.6 /100 | #139 | Excellent 8.5% |
| South Americans | 87.9 /100 | #140 | Excellent 8.5% |