Aleut vs Yaqui Male Unemployment
COMPARE
Aleut
Yaqui
Male Unemployment
Male Unemployment Comparison
Aleuts
Yaqui
6.8%
MALE UNEMPLOYMENT
0.0/ 100
METRIC RATING
308th/ 347
METRIC RANK
5.7%
MALE UNEMPLOYMENT
0.7/ 100
METRIC RATING
245th/ 347
METRIC RANK
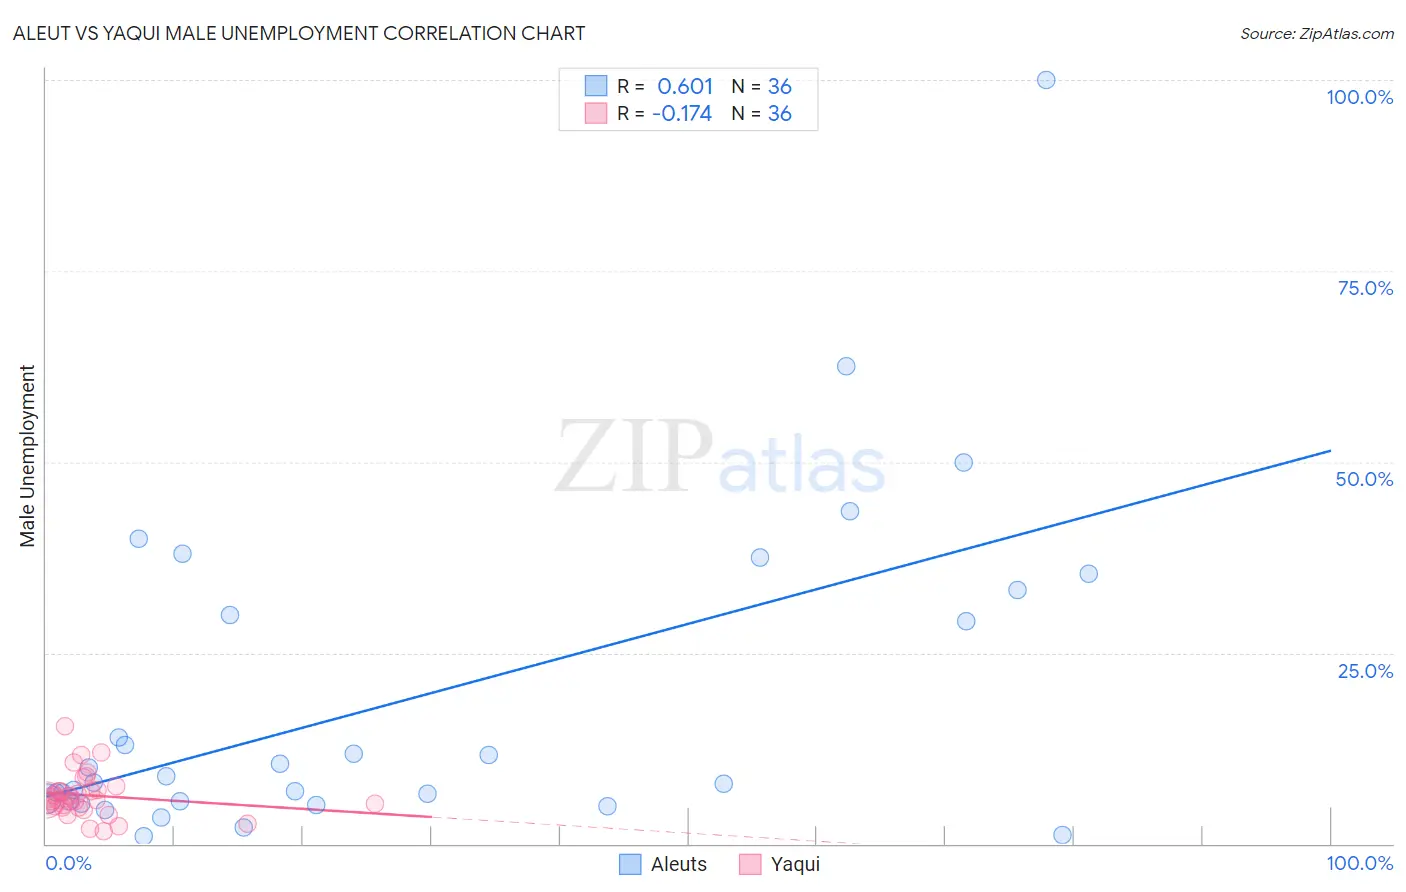
Aleut vs Yaqui Male Unemployment Correlation Chart
The statistical analysis conducted on geographies consisting of 61,714,697 people shows a significant positive correlation between the proportion of Aleuts and unemployment rate among males in the United States with a correlation coefficient (R) of 0.601 and weighted average of 6.8%. Similarly, the statistical analysis conducted on geographies consisting of 107,561,387 people shows a poor negative correlation between the proportion of Yaqui and unemployment rate among males in the United States with a correlation coefficient (R) of -0.174 and weighted average of 5.7%, a difference of 20.1%.
Male Unemployment Correlation Summary
| Measurement | Aleut | Yaqui |
| Minimum | 1.0% | 1.7% |
| Maximum | 100.0% | 15.3% |
| Range | 99.0% | 13.6% |
| Mean | 18.7% | 6.3% |
| Median | 8.4% | 5.8% |
| Interquartile 25% (IQ1) | 5.6% | 4.8% |
| Interquartile 75% (IQ3) | 31.7% | 7.0% |
| Interquartile Range (IQR) | 26.1% | 2.1% |
| Standard Deviation (Sample) | 21.2% | 2.8% |
| Standard Deviation (Population) | 20.9% | 2.8% |
Similar Demographics by Male Unemployment
Demographics Similar to Aleuts by Male Unemployment
In terms of male unemployment, the demographic groups most similar to Aleuts are Barbadian (6.9%, a difference of 0.41%), Black/African American (6.9%, a difference of 1.1%), Immigrants from Armenia (6.9%, a difference of 1.4%), Lumbee (6.9%, a difference of 1.6%), and Immigrants from Jamaica (6.7%, a difference of 1.9%).
| Demographics | Rating | Rank | Male Unemployment |
| Immigrants | Belize | 0.0 /100 | #301 | Tragic 6.6% |
| Ute | 0.0 /100 | #302 | Tragic 6.6% |
| Immigrants | West Indies | 0.0 /100 | #303 | Tragic 6.7% |
| West Indians | 0.0 /100 | #304 | Tragic 6.7% |
| Trinidadians and Tobagonians | 0.0 /100 | #305 | Tragic 6.7% |
| Immigrants | Trinidad and Tobago | 0.0 /100 | #306 | Tragic 6.7% |
| Immigrants | Jamaica | 0.0 /100 | #307 | Tragic 6.7% |
| Aleuts | 0.0 /100 | #308 | Tragic 6.8% |
| Barbadians | 0.0 /100 | #309 | Tragic 6.9% |
| Blacks/African Americans | 0.0 /100 | #310 | Tragic 6.9% |
| Immigrants | Armenia | 0.0 /100 | #311 | Tragic 6.9% |
| Lumbee | 0.0 /100 | #312 | Tragic 6.9% |
| Immigrants | Dominica | 0.0 /100 | #313 | Tragic 7.0% |
| Immigrants | Barbados | 0.0 /100 | #314 | Tragic 7.1% |
| Houma | 0.0 /100 | #315 | Tragic 7.1% |
Demographics Similar to Yaqui by Male Unemployment
In terms of male unemployment, the demographic groups most similar to Yaqui are Iroquois (5.7%, a difference of 0.090%), Immigrants from El Salvador (5.7%, a difference of 0.17%), Hawaiian (5.7%, a difference of 0.19%), Bangladeshi (5.7%, a difference of 0.21%), and Ottawa (5.7%, a difference of 0.50%).
| Demographics | Rating | Rank | Male Unemployment |
| Native Hawaiians | 1.1 /100 | #238 | Tragic 5.6% |
| Immigrants | Guatemala | 1.1 /100 | #239 | Tragic 5.6% |
| Immigrants | Cameroon | 1.0 /100 | #240 | Tragic 5.6% |
| Salvadorans | 1.0 /100 | #241 | Tragic 5.7% |
| Ottawa | 0.9 /100 | #242 | Tragic 5.7% |
| Bangladeshis | 0.8 /100 | #243 | Tragic 5.7% |
| Immigrants | El Salvador | 0.7 /100 | #244 | Tragic 5.7% |
| Yaqui | 0.7 /100 | #245 | Tragic 5.7% |
| Iroquois | 0.6 /100 | #246 | Tragic 5.7% |
| Hawaiians | 0.6 /100 | #247 | Tragic 5.7% |
| Marshallese | 0.5 /100 | #248 | Tragic 5.7% |
| Cree | 0.4 /100 | #249 | Tragic 5.7% |
| Immigrants | Bahamas | 0.4 /100 | #250 | Tragic 5.7% |
| Spanish Americans | 0.3 /100 | #251 | Tragic 5.7% |
| Mexicans | 0.2 /100 | #252 | Tragic 5.8% |