Aleut vs Sierra Leonean Male Unemployment
COMPARE
Aleut
Sierra Leonean
Male Unemployment
Male Unemployment Comparison
Aleuts
Sierra Leoneans
6.8%
MALE UNEMPLOYMENT
0.0/ 100
METRIC RATING
308th/ 347
METRIC RANK
6.2%
MALE UNEMPLOYMENT
0.0/ 100
METRIC RATING
281st/ 347
METRIC RANK
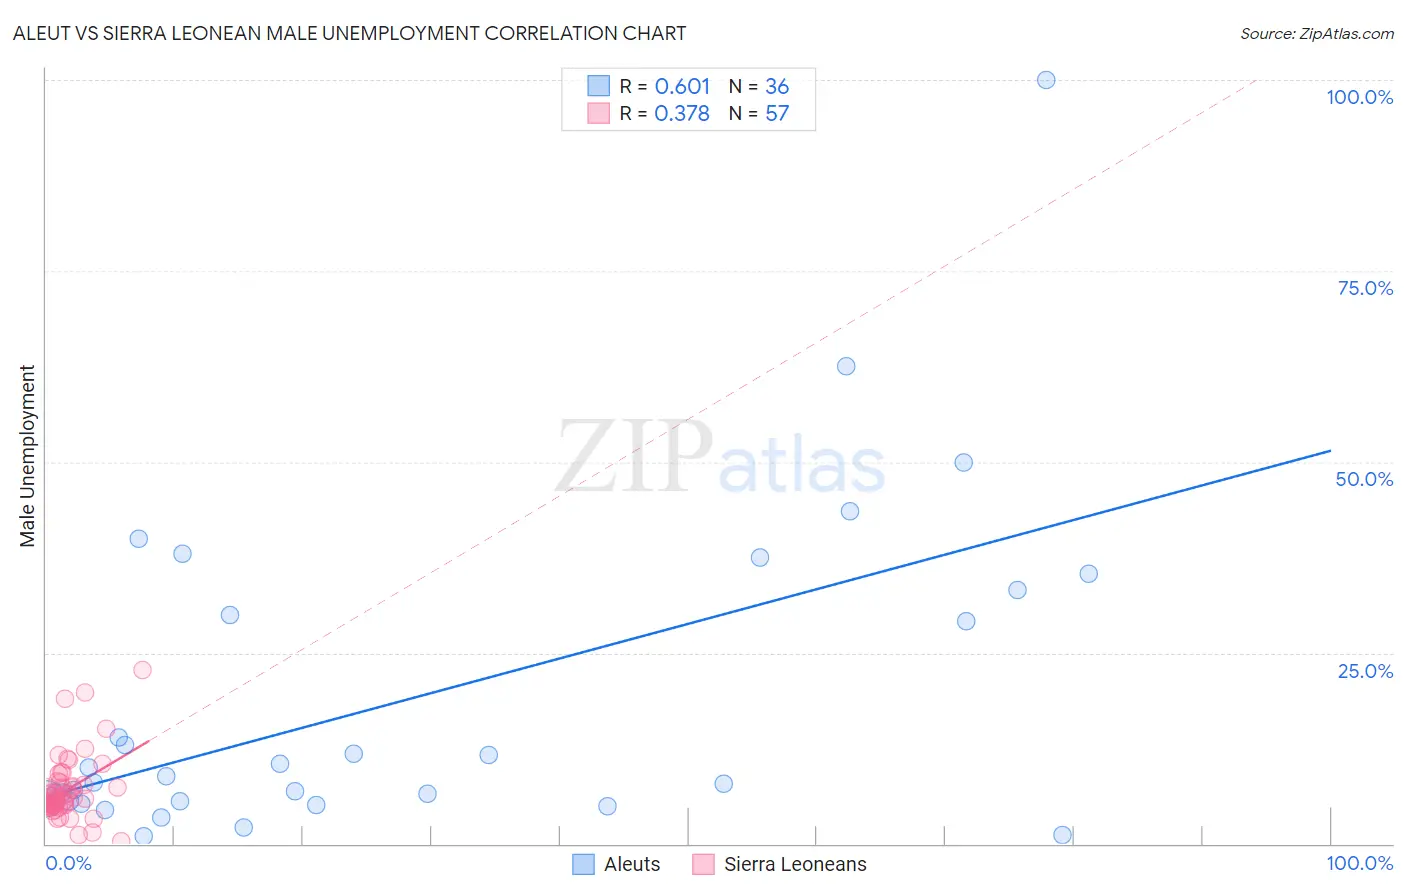
Aleut vs Sierra Leonean Male Unemployment Correlation Chart
The statistical analysis conducted on geographies consisting of 61,714,697 people shows a significant positive correlation between the proportion of Aleuts and unemployment rate among males in the United States with a correlation coefficient (R) of 0.601 and weighted average of 6.8%. Similarly, the statistical analysis conducted on geographies consisting of 83,306,317 people shows a mild positive correlation between the proportion of Sierra Leoneans and unemployment rate among males in the United States with a correlation coefficient (R) of 0.378 and weighted average of 6.2%, a difference of 10.8%.
Male Unemployment Correlation Summary
| Measurement | Aleut | Sierra Leonean |
| Minimum | 1.0% | 0.30% |
| Maximum | 100.0% | 22.8% |
| Range | 99.0% | 22.5% |
| Mean | 18.7% | 7.0% |
| Median | 8.4% | 5.9% |
| Interquartile 25% (IQ1) | 5.6% | 5.1% |
| Interquartile 75% (IQ3) | 31.7% | 7.9% |
| Interquartile Range (IQR) | 26.1% | 2.8% |
| Standard Deviation (Sample) | 21.2% | 4.2% |
| Standard Deviation (Population) | 20.9% | 4.2% |
Similar Demographics by Male Unemployment
Demographics Similar to Aleuts by Male Unemployment
In terms of male unemployment, the demographic groups most similar to Aleuts are Barbadian (6.9%, a difference of 0.41%), Black/African American (6.9%, a difference of 1.1%), Immigrants from Armenia (6.9%, a difference of 1.4%), Lumbee (6.9%, a difference of 1.6%), and Immigrants from Jamaica (6.7%, a difference of 1.9%).
| Demographics | Rating | Rank | Male Unemployment |
| Immigrants | Belize | 0.0 /100 | #301 | Tragic 6.6% |
| Ute | 0.0 /100 | #302 | Tragic 6.6% |
| Immigrants | West Indies | 0.0 /100 | #303 | Tragic 6.7% |
| West Indians | 0.0 /100 | #304 | Tragic 6.7% |
| Trinidadians and Tobagonians | 0.0 /100 | #305 | Tragic 6.7% |
| Immigrants | Trinidad and Tobago | 0.0 /100 | #306 | Tragic 6.7% |
| Immigrants | Jamaica | 0.0 /100 | #307 | Tragic 6.7% |
| Aleuts | 0.0 /100 | #308 | Tragic 6.8% |
| Barbadians | 0.0 /100 | #309 | Tragic 6.9% |
| Blacks/African Americans | 0.0 /100 | #310 | Tragic 6.9% |
| Immigrants | Armenia | 0.0 /100 | #311 | Tragic 6.9% |
| Lumbee | 0.0 /100 | #312 | Tragic 6.9% |
| Immigrants | Dominica | 0.0 /100 | #313 | Tragic 7.0% |
| Immigrants | Barbados | 0.0 /100 | #314 | Tragic 7.1% |
| Houma | 0.0 /100 | #315 | Tragic 7.1% |
Demographics Similar to Sierra Leoneans by Male Unemployment
In terms of male unemployment, the demographic groups most similar to Sierra Leoneans are Immigrants from Ghana (6.2%, a difference of 0.070%), Ecuadorian (6.2%, a difference of 0.43%), Immigrants from Western Africa (6.2%, a difference of 0.46%), Ghanaian (6.1%, a difference of 1.1%), and Spanish American Indian (6.2%, a difference of 1.1%).
| Demographics | Rating | Rank | Male Unemployment |
| Immigrants | Sierra Leone | 0.0 /100 | #274 | Tragic 6.0% |
| Menominee | 0.0 /100 | #275 | Tragic 6.0% |
| Tlingit-Haida | 0.0 /100 | #276 | Tragic 6.0% |
| Immigrants | Liberia | 0.0 /100 | #277 | Tragic 6.1% |
| Immigrants | Fiji | 0.0 /100 | #278 | Tragic 6.1% |
| Ghanaians | 0.0 /100 | #279 | Tragic 6.1% |
| Immigrants | Ghana | 0.0 /100 | #280 | Tragic 6.2% |
| Sierra Leoneans | 0.0 /100 | #281 | Tragic 6.2% |
| Ecuadorians | 0.0 /100 | #282 | Tragic 6.2% |
| Immigrants | Western Africa | 0.0 /100 | #283 | Tragic 6.2% |
| Spanish American Indians | 0.0 /100 | #284 | Tragic 6.2% |
| Immigrants | Ecuador | 0.0 /100 | #285 | Tragic 6.2% |
| Africans | 0.0 /100 | #286 | Tragic 6.3% |
| Central American Indians | 0.0 /100 | #287 | Tragic 6.3% |
| Immigrants | Senegal | 0.0 /100 | #288 | Tragic 6.3% |