Aleut vs Crow Disability Age 35 to 64
COMPARE
Aleut
Crow
Disability Age 35 to 64
Disability Age 35 to 64 Comparison
Aleuts
Crow
13.8%
DISABILITY AGE 35 TO 64
0.0/ 100
METRIC RATING
302nd/ 347
METRIC RANK
14.6%
DISABILITY AGE 35 TO 64
0.0/ 100
METRIC RATING
317th/ 347
METRIC RANK
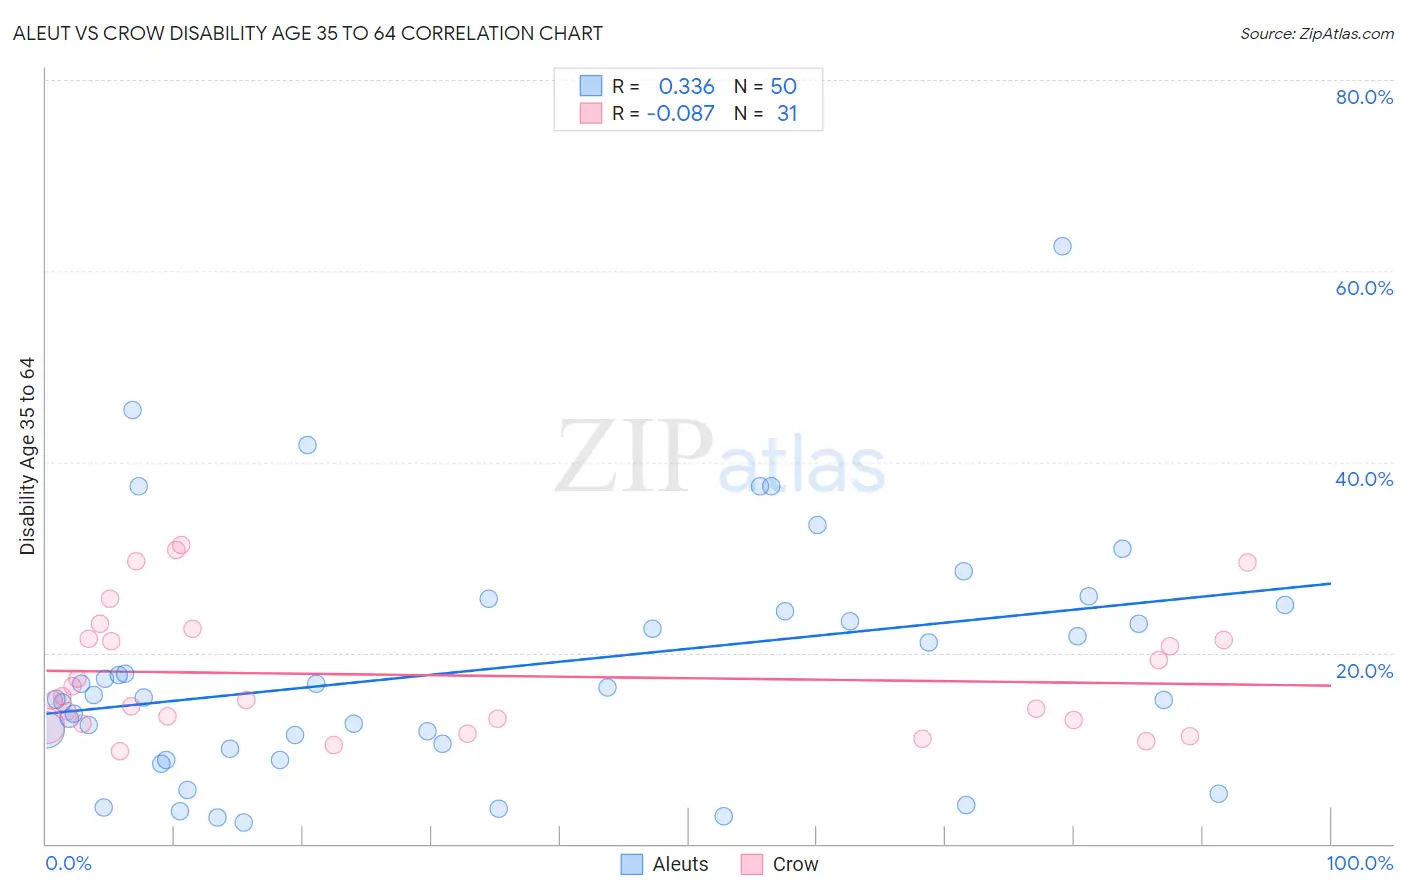
Aleut vs Crow Disability Age 35 to 64 Correlation Chart
The statistical analysis conducted on geographies consisting of 61,774,643 people shows a mild positive correlation between the proportion of Aleuts and percentage of population with a disability between the ages 34 and 64 in the United States with a correlation coefficient (R) of 0.336 and weighted average of 13.8%. Similarly, the statistical analysis conducted on geographies consisting of 59,202,172 people shows a slight negative correlation between the proportion of Crow and percentage of population with a disability between the ages 34 and 64 in the United States with a correlation coefficient (R) of -0.087 and weighted average of 14.6%, a difference of 5.7%.
Disability Age 35 to 64 Correlation Summary
| Measurement | Aleut | Crow |
| Minimum | 2.2% | 9.7% |
| Maximum | 62.6% | 31.2% |
| Range | 60.4% | 21.5% |
| Mean | 18.3% | 17.6% |
| Median | 15.4% | 15.1% |
| Interquartile 25% (IQ1) | 9.9% | 12.6% |
| Interquartile 75% (IQ3) | 24.4% | 21.5% |
| Interquartile Range (IQR) | 14.5% | 8.9% |
| Standard Deviation (Sample) | 12.6% | 6.5% |
| Standard Deviation (Population) | 12.5% | 6.4% |
Demographics Similar to Aleuts and Crow by Disability Age 35 to 64
In terms of disability age 35 to 64, the demographic groups most similar to Aleuts are Sioux (13.9%, a difference of 0.18%), Hopi (13.9%, a difference of 0.21%), American (13.9%, a difference of 0.59%), French American Indian (13.7%, a difference of 0.89%), and Delaware (13.7%, a difference of 1.2%). Similarly, the demographic groups most similar to Crow are Ottawa (14.6%, a difference of 0.070%), Immigrants from Cabo Verde (14.7%, a difference of 0.49%), Osage (14.5%, a difference of 0.87%), Alaska Native (14.5%, a difference of 1.1%), and Shoshone (14.5%, a difference of 1.1%).
| Demographics | Rating | Rank | Disability Age 35 to 64 |
| Spanish Americans | 0.0 /100 | #299 | Tragic 13.7% |
| Delaware | 0.0 /100 | #300 | Tragic 13.7% |
| French American Indians | 0.0 /100 | #301 | Tragic 13.7% |
| Aleuts | 0.0 /100 | #302 | Tragic 13.8% |
| Sioux | 0.0 /100 | #303 | Tragic 13.9% |
| Hopi | 0.0 /100 | #304 | Tragic 13.9% |
| Americans | 0.0 /100 | #305 | Tragic 13.9% |
| Immigrants | Yemen | 0.0 /100 | #306 | Tragic 14.0% |
| Blackfeet | 0.0 /100 | #307 | Tragic 14.1% |
| Inupiat | 0.0 /100 | #308 | Tragic 14.1% |
| Cree | 0.0 /100 | #309 | Tragic 14.1% |
| Cape Verdeans | 0.0 /100 | #310 | Tragic 14.1% |
| Immigrants | Azores | 0.0 /100 | #311 | Tragic 14.3% |
| Paiute | 0.0 /100 | #312 | Tragic 14.3% |
| Iroquois | 0.0 /100 | #313 | Tragic 14.4% |
| Shoshone | 0.0 /100 | #314 | Tragic 14.5% |
| Alaska Natives | 0.0 /100 | #315 | Tragic 14.5% |
| Osage | 0.0 /100 | #316 | Tragic 14.5% |
| Crow | 0.0 /100 | #317 | Tragic 14.6% |
| Ottawa | 0.0 /100 | #318 | Tragic 14.6% |
| Immigrants | Cabo Verde | 0.0 /100 | #319 | Tragic 14.7% |