Albanian vs Immigrants from Lithuania Householder Income Ages 25 - 44 years
COMPARE
Albanian
Immigrants from Lithuania
Householder Income Ages 25 - 44 years
Householder Income Ages 25 - 44 years Comparison
Albanians
Immigrants from Lithuania
$101,367
HOUSEHOLDER INCOME AGES 25 - 44 YEARS
97.8/ 100
METRIC RATING
101st/ 347
METRIC RANK
$108,149
HOUSEHOLDER INCOME AGES 25 - 44 YEARS
99.9/ 100
METRIC RATING
40th/ 347
METRIC RANK
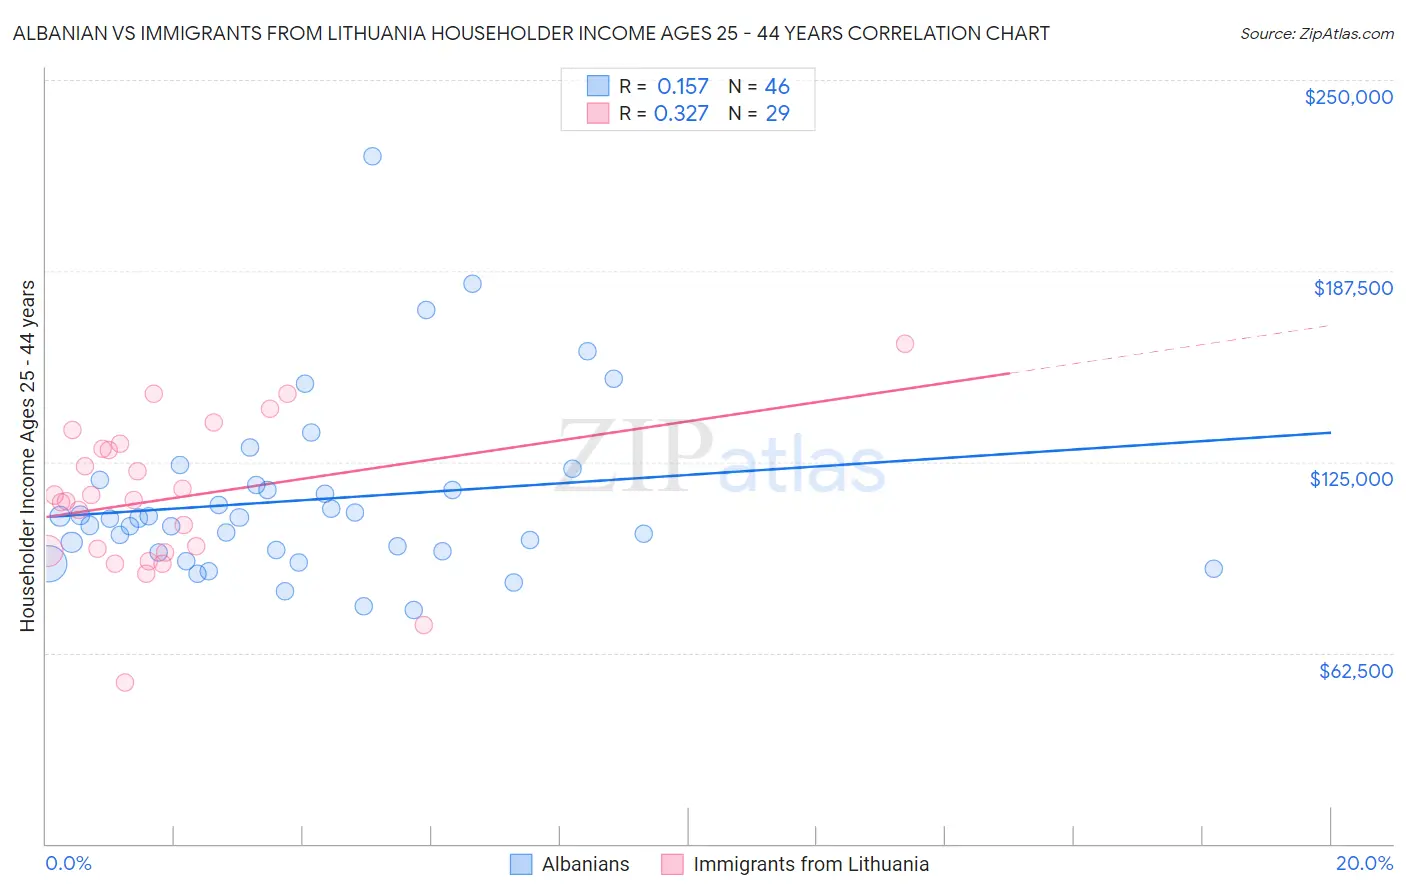
Albanian vs Immigrants from Lithuania Householder Income Ages 25 - 44 years Correlation Chart
The statistical analysis conducted on geographies consisting of 193,076,288 people shows a poor positive correlation between the proportion of Albanians and household income with householder between the ages 25 and 44 in the United States with a correlation coefficient (R) of 0.157 and weighted average of $101,367. Similarly, the statistical analysis conducted on geographies consisting of 117,642,773 people shows a mild positive correlation between the proportion of Immigrants from Lithuania and household income with householder between the ages 25 and 44 in the United States with a correlation coefficient (R) of 0.327 and weighted average of $108,149, a difference of 6.7%.
Householder Income Ages 25 - 44 years Correlation Summary
| Measurement | Albanian | Immigrants from Lithuania |
| Minimum | $76,718 | $52,861 |
| Maximum | $225,000 | $163,542 |
| Range | $148,282 | $110,681 |
| Mean | $112,576 | $112,993 |
| Median | $106,494 | $112,685 |
| Interquartile 25% (IQ1) | $95,901 | $95,623 |
| Interquartile 75% (IQ3) | $117,313 | $130,271 |
| Interquartile Range (IQR) | $21,412 | $34,649 |
| Standard Deviation (Sample) | $28,766 | $24,241 |
| Standard Deviation (Population) | $28,452 | $23,819 |
Similar Demographics by Householder Income Ages 25 - 44 years
Demographics Similar to Albanians by Householder Income Ages 25 - 44 years
In terms of householder income ages 25 - 44 years, the demographic groups most similar to Albanians are Immigrants from Argentina ($101,415, a difference of 0.050%), Taiwanese ($101,492, a difference of 0.12%), Immigrants from Lebanon ($101,124, a difference of 0.24%), Immigrants from Moldova ($101,091, a difference of 0.27%), and Immigrants from Poland ($101,065, a difference of 0.30%).
| Demographics | Rating | Rank | Householder Income Ages 25 - 44 years |
| Sri Lankans | 98.4 /100 | #94 | Exceptional $101,960 |
| Assyrians/Chaldeans/Syriacs | 98.3 /100 | #95 | Exceptional $101,936 |
| Macedonians | 98.3 /100 | #96 | Exceptional $101,882 |
| Austrians | 98.3 /100 | #97 | Exceptional $101,842 |
| Immigrants | Kazakhstan | 98.1 /100 | #98 | Exceptional $101,727 |
| Taiwanese | 97.9 /100 | #99 | Exceptional $101,492 |
| Immigrants | Argentina | 97.8 /100 | #100 | Exceptional $101,415 |
| Albanians | 97.8 /100 | #101 | Exceptional $101,367 |
| Immigrants | Lebanon | 97.4 /100 | #102 | Exceptional $101,124 |
| Immigrants | Moldova | 97.4 /100 | #103 | Exceptional $101,091 |
| Immigrants | Poland | 97.4 /100 | #104 | Exceptional $101,065 |
| Immigrants | Vietnam | 96.5 /100 | #105 | Exceptional $100,535 |
| Immigrants | Brazil | 96.5 /100 | #106 | Exceptional $100,534 |
| Northern Europeans | 96.3 /100 | #107 | Exceptional $100,457 |
| Immigrants | South Eastern Asia | 96.0 /100 | #108 | Exceptional $100,283 |
Demographics Similar to Immigrants from Lithuania by Householder Income Ages 25 - 44 years
In terms of householder income ages 25 - 44 years, the demographic groups most similar to Immigrants from Lithuania are Immigrants from Bolivia ($108,128, a difference of 0.020%), Immigrants from France ($108,257, a difference of 0.10%), Australian ($107,912, a difference of 0.22%), Soviet Union ($108,457, a difference of 0.29%), and Immigrants from Malaysia ($107,650, a difference of 0.46%).
| Demographics | Rating | Rank | Householder Income Ages 25 - 44 years |
| Bhutanese | 100.0 /100 | #33 | Exceptional $109,520 |
| Bolivians | 100.0 /100 | #34 | Exceptional $109,372 |
| Immigrants | Switzerland | 100.0 /100 | #35 | Exceptional $109,185 |
| Latvians | 100.0 /100 | #36 | Exceptional $108,926 |
| Immigrants | Russia | 100.0 /100 | #37 | Exceptional $108,751 |
| Soviet Union | 100.0 /100 | #38 | Exceptional $108,457 |
| Immigrants | France | 99.9 /100 | #39 | Exceptional $108,257 |
| Immigrants | Lithuania | 99.9 /100 | #40 | Exceptional $108,149 |
| Immigrants | Bolivia | 99.9 /100 | #41 | Exceptional $108,128 |
| Australians | 99.9 /100 | #42 | Exceptional $107,912 |
| Immigrants | Malaysia | 99.9 /100 | #43 | Exceptional $107,650 |
| Immigrants | Indonesia | 99.9 /100 | #44 | Exceptional $107,627 |
| Israelis | 99.9 /100 | #45 | Exceptional $107,579 |
| Immigrants | Belarus | 99.9 /100 | #46 | Exceptional $107,393 |
| Estonians | 99.9 /100 | #47 | Exceptional $107,269 |