Albanian vs Alaskan Athabascan Unemployment Among Ages 20 to 24 years
COMPARE
Albanian
Alaskan Athabascan
Unemployment Among Ages 20 to 24 years
Unemployment Among Ages 20 to 24 years Comparison
Albanians
Alaskan Athabascans
10.8%
UNEMPLOYMENT AMONG AGES 20 TO 24 YEARS
0.5/ 100
METRIC RATING
250th/ 347
METRIC RANK
11.6%
UNEMPLOYMENT AMONG AGES 20 TO 24 YEARS
0.0/ 100
METRIC RATING
280th/ 347
METRIC RANK
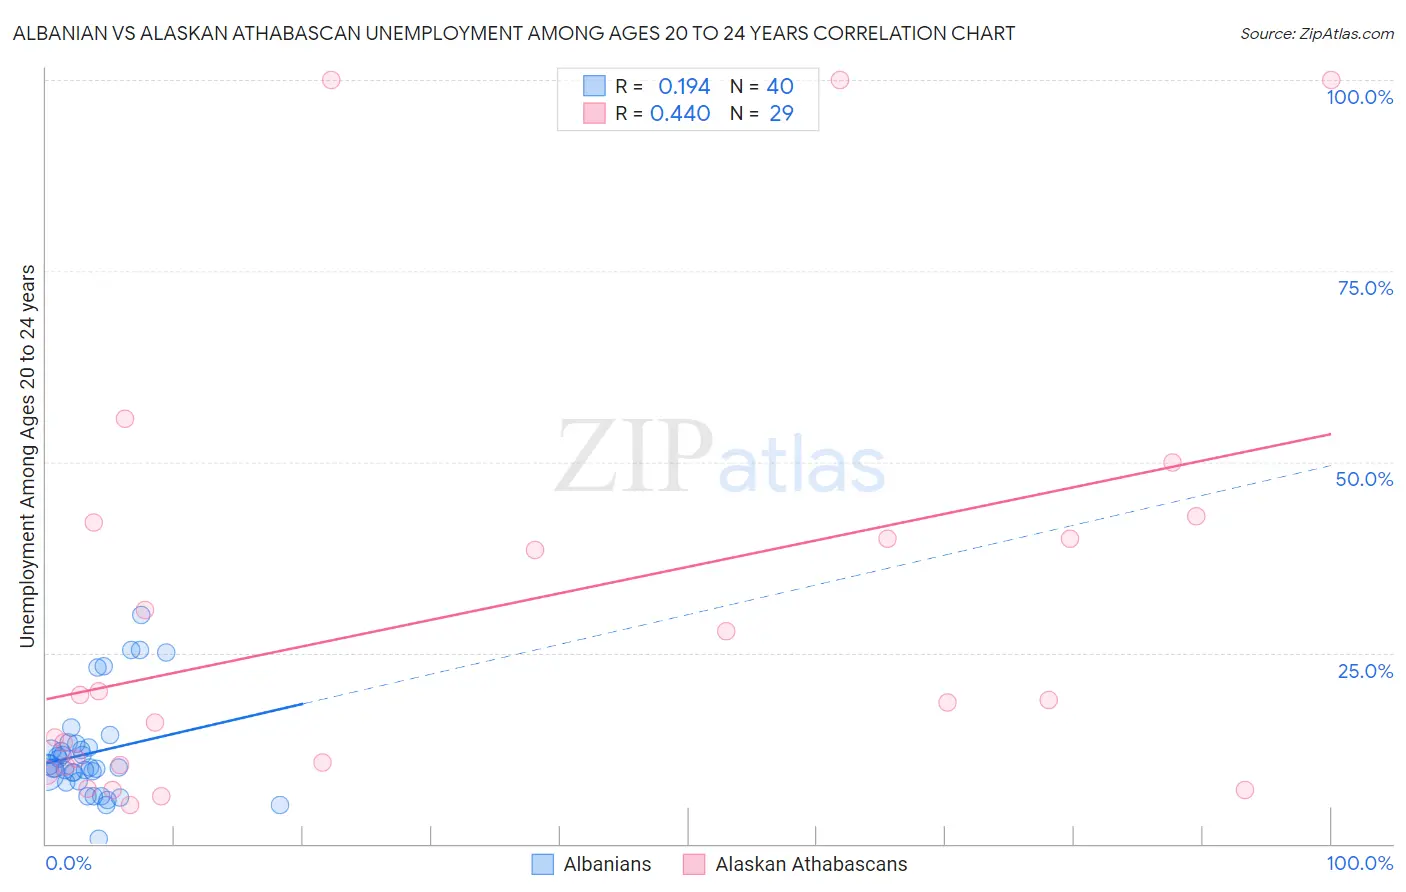
Albanian vs Alaskan Athabascan Unemployment Among Ages 20 to 24 years Correlation Chart
The statistical analysis conducted on geographies consisting of 189,502,346 people shows a poor positive correlation between the proportion of Albanians and unemployment rate among population between the ages 20 and 24 in the United States with a correlation coefficient (R) of 0.194 and weighted average of 10.8%. Similarly, the statistical analysis conducted on geographies consisting of 45,208,950 people shows a moderate positive correlation between the proportion of Alaskan Athabascans and unemployment rate among population between the ages 20 and 24 in the United States with a correlation coefficient (R) of 0.440 and weighted average of 11.6%, a difference of 7.5%.
Unemployment Among Ages 20 to 24 years Correlation Summary
| Measurement | Albanian | Alaskan Athabascan |
| Minimum | 0.60% | 5.0% |
| Maximum | 30.0% | 100.0% |
| Range | 29.4% | 95.0% |
| Mean | 11.9% | 30.0% |
| Median | 10.0% | 18.8% |
| Interquartile 25% (IQ1) | 8.7% | 10.2% |
| Interquartile 75% (IQ3) | 12.8% | 41.1% |
| Interquartile Range (IQR) | 4.1% | 30.9% |
| Standard Deviation (Sample) | 6.4% | 28.2% |
| Standard Deviation (Population) | 6.3% | 27.7% |
Similar Demographics by Unemployment Among Ages 20 to 24 years
Demographics Similar to Albanians by Unemployment Among Ages 20 to 24 years
In terms of unemployment among ages 20 to 24 years, the demographic groups most similar to Albanians are South American Indian (10.8%, a difference of 0.040%), Immigrants from Panama (10.8%, a difference of 0.060%), Immigrants from Syria (10.8%, a difference of 0.13%), Spanish American (10.8%, a difference of 0.18%), and Cree (10.8%, a difference of 0.24%).
| Demographics | Rating | Rank | Unemployment Among Ages 20 to 24 years |
| Immigrants | Belarus | 1.3 /100 | #243 | Tragic 10.7% |
| Immigrants | Mexico | 1.2 /100 | #244 | Tragic 10.7% |
| Hispanics or Latinos | 1.0 /100 | #245 | Tragic 10.7% |
| Immigrants | Iran | 0.9 /100 | #246 | Tragic 10.8% |
| Immigrants | Albania | 0.7 /100 | #247 | Tragic 10.8% |
| Cree | 0.6 /100 | #248 | Tragic 10.8% |
| South American Indians | 0.5 /100 | #249 | Tragic 10.8% |
| Albanians | 0.5 /100 | #250 | Tragic 10.8% |
| Immigrants | Panama | 0.4 /100 | #251 | Tragic 10.8% |
| Immigrants | Syria | 0.4 /100 | #252 | Tragic 10.8% |
| Spanish Americans | 0.4 /100 | #253 | Tragic 10.8% |
| Liberians | 0.3 /100 | #254 | Tragic 10.8% |
| Immigrants | Israel | 0.3 /100 | #255 | Tragic 10.8% |
| Immigrants | Bahamas | 0.3 /100 | #256 | Tragic 10.9% |
| Immigrants | Western Asia | 0.3 /100 | #257 | Tragic 10.9% |
Demographics Similar to Alaskan Athabascans by Unemployment Among Ages 20 to 24 years
In terms of unemployment among ages 20 to 24 years, the demographic groups most similar to Alaskan Athabascans are Bahamian (11.6%, a difference of 0.35%), Armenian (11.7%, a difference of 0.47%), Colville (11.6%, a difference of 0.60%), Immigrants from Cameroon (11.7%, a difference of 0.62%), and African (11.5%, a difference of 0.63%).
| Demographics | Rating | Rank | Unemployment Among Ages 20 to 24 years |
| Immigrants | Nigeria | 0.0 /100 | #273 | Tragic 11.5% |
| Cape Verdeans | 0.0 /100 | #274 | Tragic 11.5% |
| Senegalese | 0.0 /100 | #275 | Tragic 11.5% |
| Sierra Leoneans | 0.0 /100 | #276 | Tragic 11.5% |
| Africans | 0.0 /100 | #277 | Tragic 11.5% |
| Colville | 0.0 /100 | #278 | Tragic 11.6% |
| Bahamians | 0.0 /100 | #279 | Tragic 11.6% |
| Alaskan Athabascans | 0.0 /100 | #280 | Tragic 11.6% |
| Armenians | 0.0 /100 | #281 | Tragic 11.7% |
| Immigrants | Cameroon | 0.0 /100 | #282 | Tragic 11.7% |
| Ghanaians | 0.0 /100 | #283 | Tragic 11.7% |
| Immigrants | Western Africa | 0.0 /100 | #284 | Tragic 11.7% |
| Soviet Union | 0.0 /100 | #285 | Tragic 11.7% |
| Ecuadorians | 0.0 /100 | #286 | Tragic 11.8% |
| Immigrants | Ecuador | 0.0 /100 | #287 | Tragic 11.8% |