Albanian vs Mexican American Indian Unemployment Among Women with Children Under 6 years
COMPARE
Albanian
Mexican American Indian
Unemployment Among Women with Children Under 6 years
Unemployment Among Women with Children Under 6 years Comparison
Albanians
Mexican American Indians
7.2%
UNEMPLOYMENT AMONG WOMEN WITH CHILDREN UNDER 6 YEARS
98.0/ 100
METRIC RATING
92nd/ 347
METRIC RANK
8.5%
UNEMPLOYMENT AMONG WOMEN WITH CHILDREN UNDER 6 YEARS
0.1/ 100
METRIC RATING
272nd/ 347
METRIC RANK
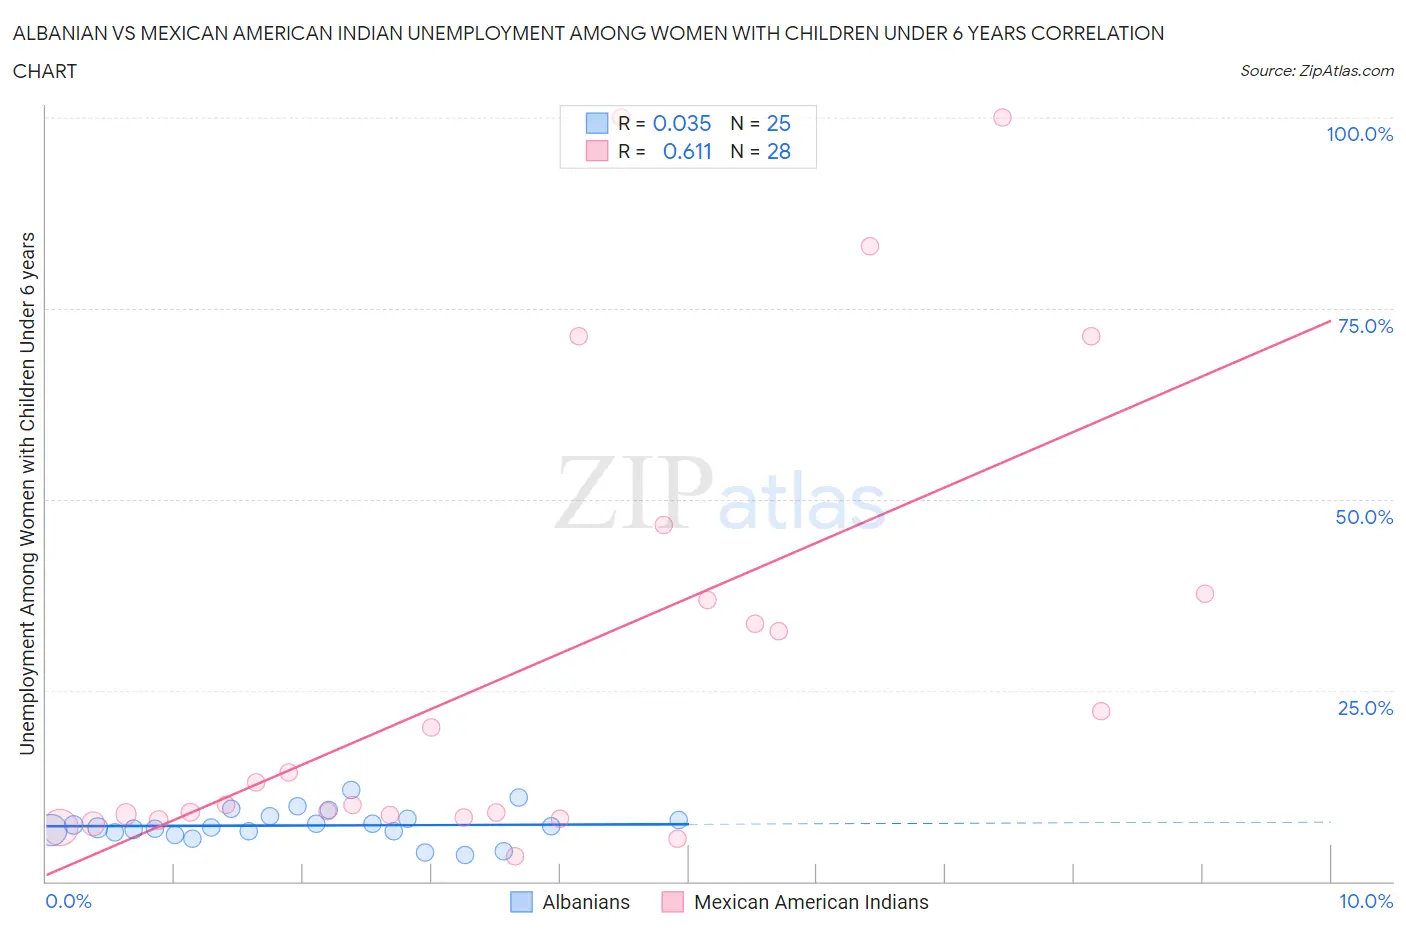
Albanian vs Mexican American Indian Unemployment Among Women with Children Under 6 years Correlation Chart
The statistical analysis conducted on geographies consisting of 159,066,011 people shows no correlation between the proportion of Albanians and unemployment rate among women with children under the age of 6 in the United States with a correlation coefficient (R) of 0.035 and weighted average of 7.2%. Similarly, the statistical analysis conducted on geographies consisting of 260,154,891 people shows a significant positive correlation between the proportion of Mexican American Indians and unemployment rate among women with children under the age of 6 in the United States with a correlation coefficient (R) of 0.611 and weighted average of 8.5%, a difference of 19.0%.
Unemployment Among Women with Children Under 6 years Correlation Summary
| Measurement | Albanian | Mexican American Indian |
| Minimum | 3.4% | 3.3% |
| Maximum | 12.0% | 100.0% |
| Range | 8.6% | 96.7% |
| Mean | 7.3% | 28.4% |
| Median | 7.0% | 11.4% |
| Interquartile 25% (IQ1) | 6.5% | 8.5% |
| Interquartile 75% (IQ3) | 8.4% | 37.3% |
| Interquartile Range (IQR) | 1.9% | 28.8% |
| Standard Deviation (Sample) | 2.0% | 29.7% |
| Standard Deviation (Population) | 2.0% | 29.2% |
Similar Demographics by Unemployment Among Women with Children Under 6 years
Demographics Similar to Albanians by Unemployment Among Women with Children Under 6 years
In terms of unemployment among women with children under 6 years, the demographic groups most similar to Albanians are Danish (7.1%, a difference of 0.14%), New Zealander (7.2%, a difference of 0.18%), Immigrants from Spain (7.1%, a difference of 0.20%), Immigrants from Denmark (7.1%, a difference of 0.25%), and Macedonian (7.2%, a difference of 0.25%).
| Demographics | Rating | Rank | Unemployment Among Women with Children Under 6 years |
| Immigrants | Romania | 98.7 /100 | #85 | Exceptional 7.1% |
| Immigrants | Zimbabwe | 98.6 /100 | #86 | Exceptional 7.1% |
| Alsatians | 98.4 /100 | #87 | Exceptional 7.1% |
| Immigrants | Hungary | 98.3 /100 | #88 | Exceptional 7.1% |
| Immigrants | Denmark | 98.3 /100 | #89 | Exceptional 7.1% |
| Immigrants | Spain | 98.2 /100 | #90 | Exceptional 7.1% |
| Danes | 98.2 /100 | #91 | Exceptional 7.1% |
| Albanians | 98.0 /100 | #92 | Exceptional 7.2% |
| New Zealanders | 97.8 /100 | #93 | Exceptional 7.2% |
| Macedonians | 97.7 /100 | #94 | Exceptional 7.2% |
| Romanians | 97.7 /100 | #95 | Exceptional 7.2% |
| Immigrants | Eastern Africa | 97.7 /100 | #96 | Exceptional 7.2% |
| Immigrants | South Eastern Asia | 97.6 /100 | #97 | Exceptional 7.2% |
| Russians | 97.5 /100 | #98 | Exceptional 7.2% |
| Immigrants | Europe | 97.5 /100 | #99 | Exceptional 7.2% |
Demographics Similar to Mexican American Indians by Unemployment Among Women with Children Under 6 years
In terms of unemployment among women with children under 6 years, the demographic groups most similar to Mexican American Indians are Slovak (8.5%, a difference of 0.080%), Immigrants from Congo (8.5%, a difference of 0.56%), Immigrants from Senegal (8.5%, a difference of 0.57%), Immigrants from Cameroon (8.6%, a difference of 0.75%), and Immigrants from Latin America (8.6%, a difference of 0.80%).
| Demographics | Rating | Rank | Unemployment Among Women with Children Under 6 years |
| French Canadians | 0.3 /100 | #265 | Tragic 8.4% |
| Immigrants | Honduras | 0.3 /100 | #266 | Tragic 8.4% |
| Belizeans | 0.2 /100 | #267 | Tragic 8.4% |
| Sub-Saharan Africans | 0.2 /100 | #268 | Tragic 8.4% |
| Immigrants | Haiti | 0.2 /100 | #269 | Tragic 8.4% |
| Immigrants | Senegal | 0.2 /100 | #270 | Tragic 8.5% |
| Immigrants | Congo | 0.2 /100 | #271 | Tragic 8.5% |
| Mexican American Indians | 0.1 /100 | #272 | Tragic 8.5% |
| Slovaks | 0.1 /100 | #273 | Tragic 8.5% |
| Immigrants | Cameroon | 0.1 /100 | #274 | Tragic 8.6% |
| Immigrants | Latin America | 0.1 /100 | #275 | Tragic 8.6% |
| Yaqui | 0.0 /100 | #276 | Tragic 8.6% |
| Haitians | 0.0 /100 | #277 | Tragic 8.6% |
| Immigrants | Dominica | 0.0 /100 | #278 | Tragic 8.6% |
| Immigrants | Guatemala | 0.0 /100 | #279 | Tragic 8.6% |