Albanian vs Cape Verdean Unemployment Among Women with Children Under 6 years
COMPARE
Albanian
Cape Verdean
Unemployment Among Women with Children Under 6 years
Unemployment Among Women with Children Under 6 years Comparison
Albanians
Cape Verdeans
7.2%
UNEMPLOYMENT AMONG WOMEN WITH CHILDREN UNDER 6 YEARS
98.0/ 100
METRIC RATING
92nd/ 347
METRIC RANK
5.9%
UNEMPLOYMENT AMONG WOMEN WITH CHILDREN UNDER 6 YEARS
100.0/ 100
METRIC RATING
5th/ 347
METRIC RANK
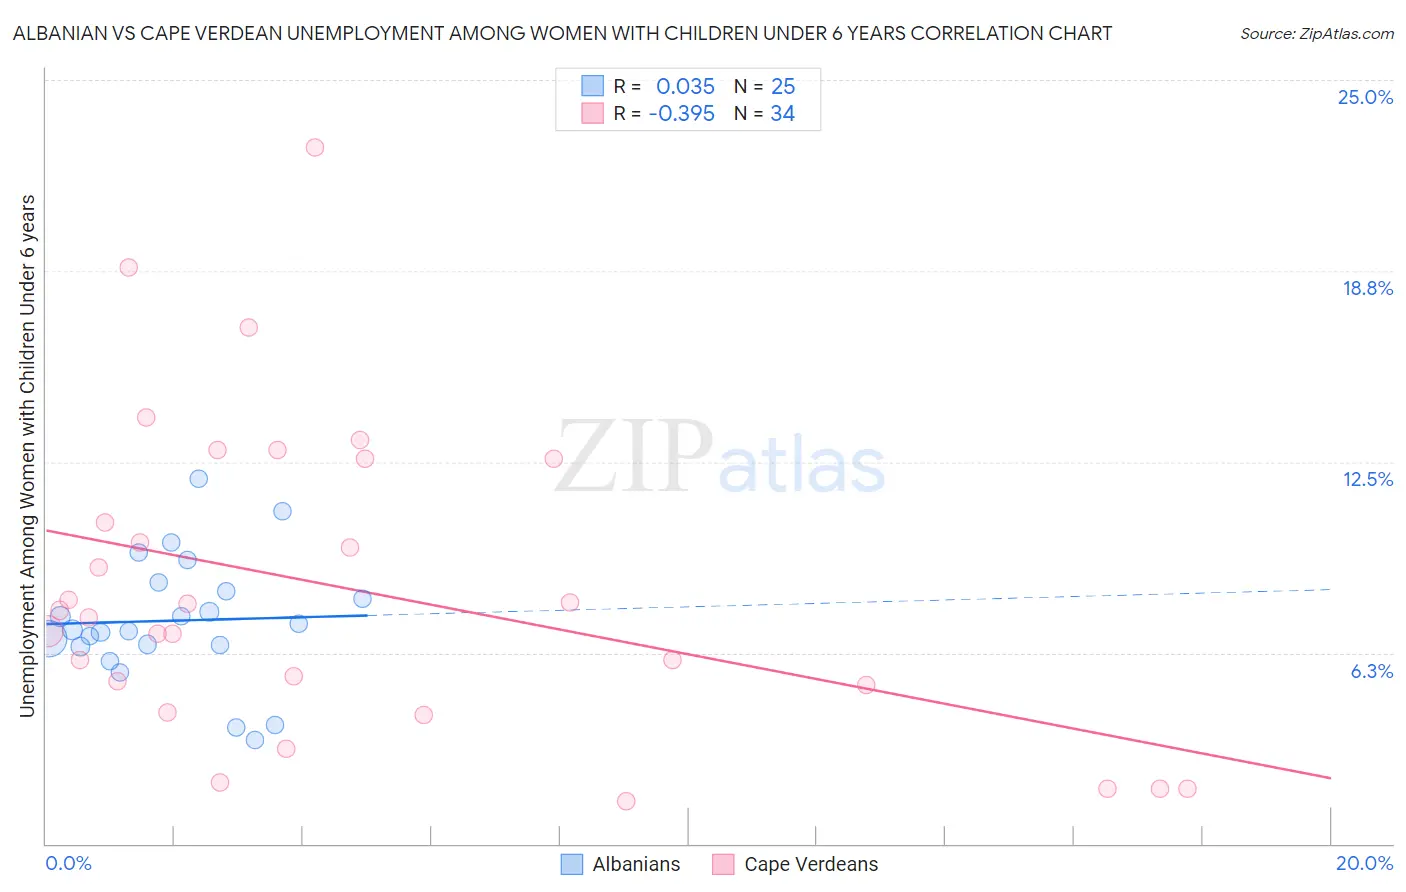
Albanian vs Cape Verdean Unemployment Among Women with Children Under 6 years Correlation Chart
The statistical analysis conducted on geographies consisting of 159,066,011 people shows no correlation between the proportion of Albanians and unemployment rate among women with children under the age of 6 in the United States with a correlation coefficient (R) of 0.035 and weighted average of 7.2%. Similarly, the statistical analysis conducted on geographies consisting of 96,300,007 people shows a mild negative correlation between the proportion of Cape Verdeans and unemployment rate among women with children under the age of 6 in the United States with a correlation coefficient (R) of -0.395 and weighted average of 5.9%, a difference of 20.3%.
Unemployment Among Women with Children Under 6 years Correlation Summary
| Measurement | Albanian | Cape Verdean |
| Minimum | 3.4% | 1.4% |
| Maximum | 12.0% | 22.8% |
| Range | 8.6% | 21.4% |
| Mean | 7.3% | 8.3% |
| Median | 7.0% | 7.5% |
| Interquartile 25% (IQ1) | 6.5% | 5.2% |
| Interquartile 75% (IQ3) | 8.4% | 12.6% |
| Interquartile Range (IQR) | 1.9% | 7.4% |
| Standard Deviation (Sample) | 2.0% | 5.1% |
| Standard Deviation (Population) | 2.0% | 5.0% |
Similar Demographics by Unemployment Among Women with Children Under 6 years
Demographics Similar to Albanians by Unemployment Among Women with Children Under 6 years
In terms of unemployment among women with children under 6 years, the demographic groups most similar to Albanians are Danish (7.1%, a difference of 0.14%), New Zealander (7.2%, a difference of 0.18%), Immigrants from Spain (7.1%, a difference of 0.20%), Immigrants from Denmark (7.1%, a difference of 0.25%), and Macedonian (7.2%, a difference of 0.25%).
| Demographics | Rating | Rank | Unemployment Among Women with Children Under 6 years |
| Immigrants | Romania | 98.7 /100 | #85 | Exceptional 7.1% |
| Immigrants | Zimbabwe | 98.6 /100 | #86 | Exceptional 7.1% |
| Alsatians | 98.4 /100 | #87 | Exceptional 7.1% |
| Immigrants | Hungary | 98.3 /100 | #88 | Exceptional 7.1% |
| Immigrants | Denmark | 98.3 /100 | #89 | Exceptional 7.1% |
| Immigrants | Spain | 98.2 /100 | #90 | Exceptional 7.1% |
| Danes | 98.2 /100 | #91 | Exceptional 7.1% |
| Albanians | 98.0 /100 | #92 | Exceptional 7.2% |
| New Zealanders | 97.8 /100 | #93 | Exceptional 7.2% |
| Macedonians | 97.7 /100 | #94 | Exceptional 7.2% |
| Romanians | 97.7 /100 | #95 | Exceptional 7.2% |
| Immigrants | Eastern Africa | 97.7 /100 | #96 | Exceptional 7.2% |
| Immigrants | South Eastern Asia | 97.6 /100 | #97 | Exceptional 7.2% |
| Russians | 97.5 /100 | #98 | Exceptional 7.2% |
| Immigrants | Europe | 97.5 /100 | #99 | Exceptional 7.2% |
Demographics Similar to Cape Verdeans by Unemployment Among Women with Children Under 6 years
In terms of unemployment among women with children under 6 years, the demographic groups most similar to Cape Verdeans are Cambodian (5.9%, a difference of 1.0%), Immigrants from Taiwan (6.0%, a difference of 1.7%), Okinawan (5.8%, a difference of 1.9%), Taiwanese (6.1%, a difference of 2.2%), and Immigrants from India (6.1%, a difference of 2.7%).
| Demographics | Rating | Rank | Unemployment Among Women with Children Under 6 years |
| Immigrants | Cabo Verde | 100.0 /100 | #1 | Exceptional 5.4% |
| Immigrants | Hong Kong | 100.0 /100 | #2 | Exceptional 5.8% |
| Okinawans | 100.0 /100 | #3 | Exceptional 5.8% |
| Cambodians | 100.0 /100 | #4 | Exceptional 5.9% |
| Cape Verdeans | 100.0 /100 | #5 | Exceptional 5.9% |
| Immigrants | Taiwan | 100.0 /100 | #6 | Exceptional 6.0% |
| Taiwanese | 100.0 /100 | #7 | Exceptional 6.1% |
| Immigrants | India | 100.0 /100 | #8 | Exceptional 6.1% |
| Filipinos | 100.0 /100 | #9 | Exceptional 6.1% |
| Immigrants | China | 100.0 /100 | #10 | Exceptional 6.2% |
| Indians (Asian) | 100.0 /100 | #11 | Exceptional 6.3% |
| Immigrants | Singapore | 100.0 /100 | #12 | Exceptional 6.3% |
| Immigrants | Eastern Asia | 100.0 /100 | #13 | Exceptional 6.3% |
| Immigrants | Bulgaria | 100.0 /100 | #14 | Exceptional 6.3% |
| Thais | 100.0 /100 | #15 | Exceptional 6.3% |