Alaskan Athabascan vs Immigrants from Albania Unemployment Among Ages 35 to 44 years
COMPARE
Alaskan Athabascan
Immigrants from Albania
Unemployment Among Ages 35 to 44 years
Unemployment Among Ages 35 to 44 years Comparison
Alaskan Athabascans
Immigrants from Albania
8.6%
UNEMPLOYMENT AMONG AGES 35 TO 44 YEARS
0.0/ 100
METRIC RATING
340th/ 347
METRIC RANK
4.8%
UNEMPLOYMENT AMONG AGES 35 TO 44 YEARS
30.5/ 100
METRIC RATING
192nd/ 347
METRIC RANK
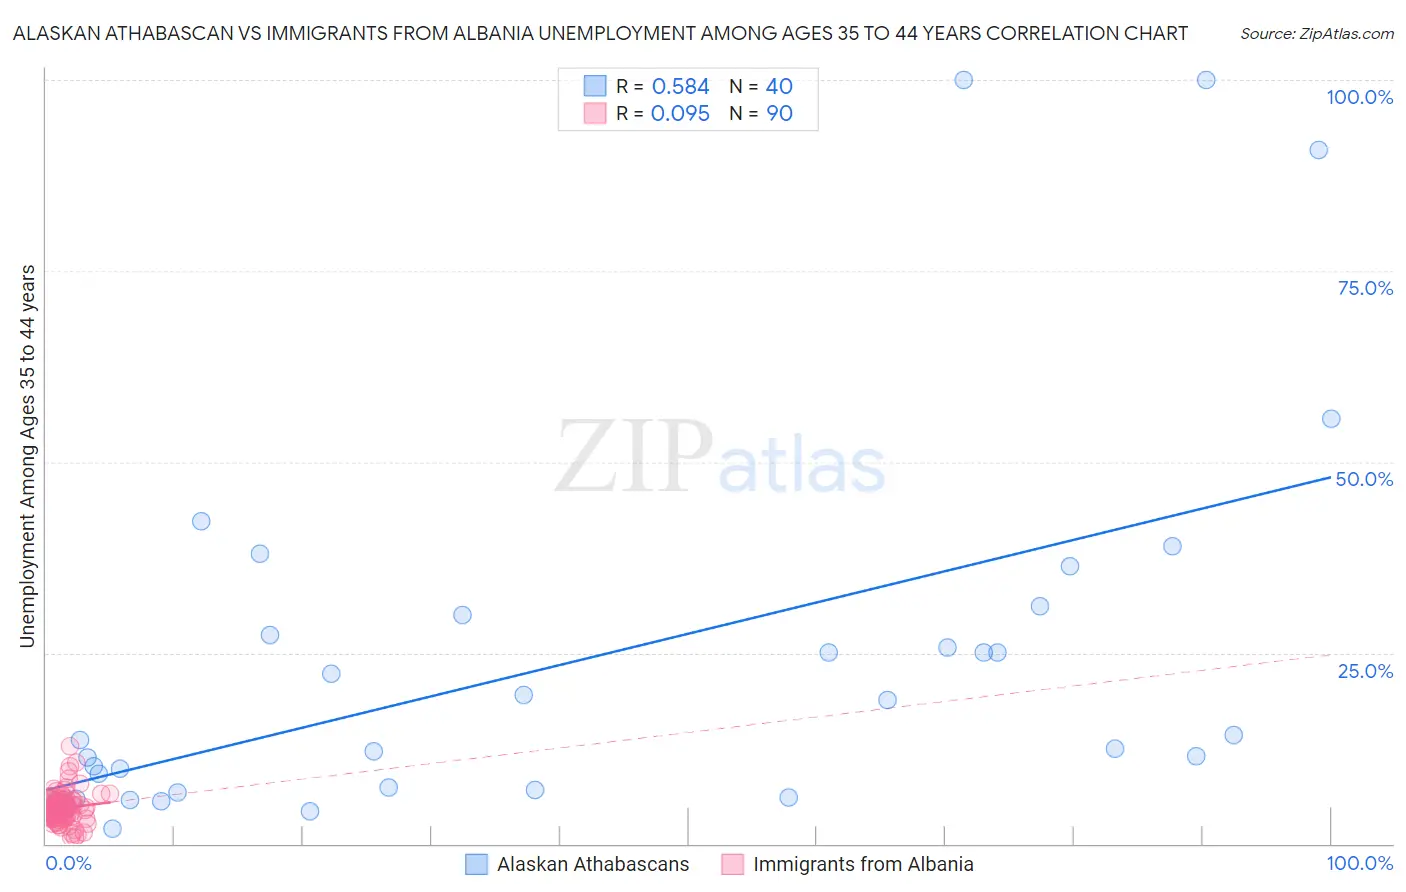
Alaskan Athabascan vs Immigrants from Albania Unemployment Among Ages 35 to 44 years Correlation Chart
The statistical analysis conducted on geographies consisting of 45,477,715 people shows a substantial positive correlation between the proportion of Alaskan Athabascans and unemployment rate among population between the ages 35 and 44 in the United States with a correlation coefficient (R) of 0.584 and weighted average of 8.6%. Similarly, the statistical analysis conducted on geographies consisting of 118,529,524 people shows a slight positive correlation between the proportion of Immigrants from Albania and unemployment rate among population between the ages 35 and 44 in the United States with a correlation coefficient (R) of 0.095 and weighted average of 4.8%, a difference of 81.4%.
Unemployment Among Ages 35 to 44 years Correlation Summary
| Measurement | Alaskan Athabascan | Immigrants from Albania |
| Minimum | 2.0% | 0.80% |
| Maximum | 100.0% | 12.8% |
| Range | 98.0% | 12.0% |
| Mean | 23.2% | 4.7% |
| Median | 13.0% | 4.5% |
| Interquartile 25% (IQ1) | 6.4% | 3.5% |
| Interquartile 75% (IQ3) | 28.7% | 5.5% |
| Interquartile Range (IQR) | 22.4% | 2.0% |
| Standard Deviation (Sample) | 24.8% | 2.0% |
| Standard Deviation (Population) | 24.5% | 2.0% |
Similar Demographics by Unemployment Among Ages 35 to 44 years
Demographics Similar to Alaskan Athabascans by Unemployment Among Ages 35 to 44 years
In terms of unemployment among ages 35 to 44 years, the demographic groups most similar to Alaskan Athabascans are Inupiat (8.6%, a difference of 0.69%), Cheyenne (8.5%, a difference of 1.8%), Tohono O'odham (8.4%, a difference of 2.3%), Apache (8.4%, a difference of 2.7%), and Hopi (8.9%, a difference of 2.9%).
| Demographics | Rating | Rank | Unemployment Among Ages 35 to 44 years |
| Puerto Ricans | 0.0 /100 | #333 | Tragic 7.6% |
| Houma | 0.0 /100 | #334 | Tragic 7.8% |
| Sioux | 0.0 /100 | #335 | Tragic 8.4% |
| Apache | 0.0 /100 | #336 | Tragic 8.4% |
| Tohono O'odham | 0.0 /100 | #337 | Tragic 8.4% |
| Cheyenne | 0.0 /100 | #338 | Tragic 8.5% |
| Inupiat | 0.0 /100 | #339 | Tragic 8.6% |
| Alaskan Athabascans | 0.0 /100 | #340 | Tragic 8.6% |
| Hopi | 0.0 /100 | #341 | Tragic 8.9% |
| Navajo | 0.0 /100 | #342 | Tragic 9.3% |
| Arapaho | 0.0 /100 | #343 | Tragic 10.3% |
| Pima | 0.0 /100 | #344 | Tragic 11.8% |
| Yup'ik | 0.0 /100 | #345 | Tragic 14.4% |
| Crow | 0.0 /100 | #346 | Tragic 15.7% |
| Yuman | 0.0 /100 | #347 | Tragic 16.9% |
Demographics Similar to Immigrants from Albania by Unemployment Among Ages 35 to 44 years
In terms of unemployment among ages 35 to 44 years, the demographic groups most similar to Immigrants from Albania are Spanish (4.8%, a difference of 0.010%), Korean (4.8%, a difference of 0.20%), Bangladeshi (4.8%, a difference of 0.21%), Immigrants from South America (4.7%, a difference of 0.26%), and Immigrants from Southern Europe (4.7%, a difference of 0.27%).
| Demographics | Rating | Rank | Unemployment Among Ages 35 to 44 years |
| Immigrants | Costa Rica | 37.0 /100 | #185 | Fair 4.7% |
| Cypriots | 36.5 /100 | #186 | Fair 4.7% |
| Malaysians | 35.5 /100 | #187 | Fair 4.7% |
| Immigrants | Laos | 34.5 /100 | #188 | Fair 4.7% |
| Immigrants | Congo | 33.9 /100 | #189 | Fair 4.7% |
| Immigrants | Southern Europe | 33.8 /100 | #190 | Fair 4.7% |
| Immigrants | South America | 33.8 /100 | #191 | Fair 4.7% |
| Immigrants | Albania | 30.5 /100 | #192 | Fair 4.8% |
| Spanish | 30.4 /100 | #193 | Fair 4.8% |
| Koreans | 28.1 /100 | #194 | Fair 4.8% |
| Bangladeshis | 28.0 /100 | #195 | Fair 4.8% |
| Immigrants | Syria | 23.6 /100 | #196 | Fair 4.8% |
| Immigrants | Oceania | 23.2 /100 | #197 | Fair 4.8% |
| Immigrants | Thailand | 22.9 /100 | #198 | Fair 4.8% |
| Immigrants | Middle Africa | 21.9 /100 | #199 | Fair 4.8% |