Alaska Native vs Colombian Unemployment
COMPARE
Alaska Native
Colombian
Unemployment
Unemployment Comparison
Alaska Natives
Colombians
7.2%
UNEMPLOYMENT
0.0/ 100
METRIC RATING
329th/ 347
METRIC RANK
5.2%
UNEMPLOYMENT
61.1/ 100
METRIC RATING
167th/ 347
METRIC RANK
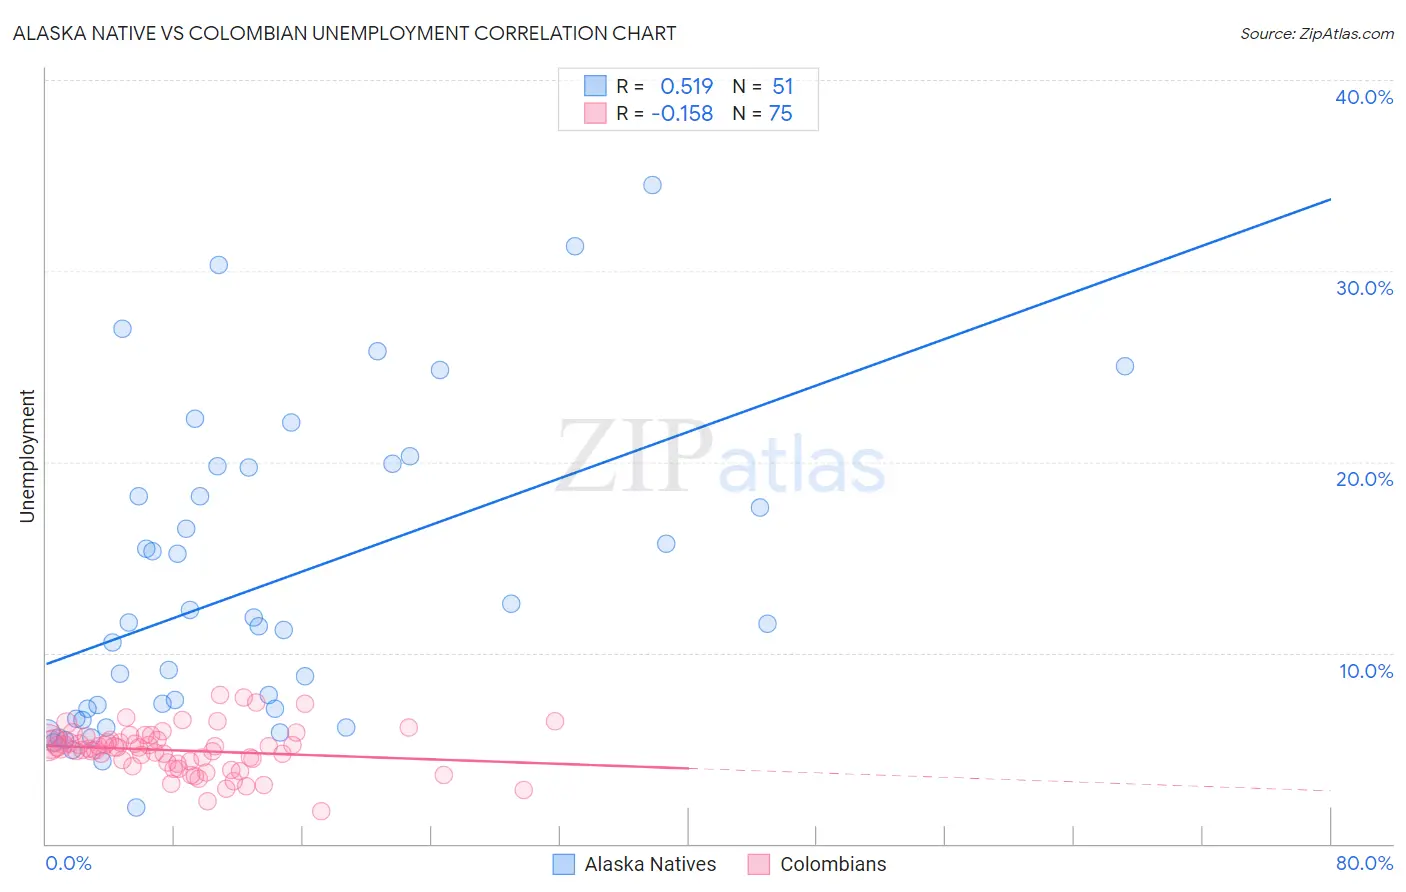
Alaska Native vs Colombian Unemployment Correlation Chart
The statistical analysis conducted on geographies consisting of 76,749,531 people shows a substantial positive correlation between the proportion of Alaska Natives and unemployment in the United States with a correlation coefficient (R) of 0.519 and weighted average of 7.2%. Similarly, the statistical analysis conducted on geographies consisting of 419,300,777 people shows a poor negative correlation between the proportion of Colombians and unemployment in the United States with a correlation coefficient (R) of -0.158 and weighted average of 5.2%, a difference of 38.7%.
Unemployment Correlation Summary
| Measurement | Alaska Native | Colombian |
| Minimum | 1.9% | 1.7% |
| Maximum | 34.5% | 7.8% |
| Range | 32.6% | 6.1% |
| Mean | 13.5% | 4.9% |
| Median | 11.5% | 5.0% |
| Interquartile 25% (IQ1) | 6.6% | 4.2% |
| Interquartile 75% (IQ3) | 19.7% | 5.4% |
| Interquartile Range (IQR) | 13.1% | 1.2% |
| Standard Deviation (Sample) | 8.0% | 1.2% |
| Standard Deviation (Population) | 8.0% | 1.2% |
Similar Demographics by Unemployment
Demographics Similar to Alaska Natives by Unemployment
In terms of unemployment, the demographic groups most similar to Alaska Natives are Tsimshian (7.2%, a difference of 0.31%), Pueblo (7.2%, a difference of 1.2%), Yakama (7.3%, a difference of 1.3%), Dominican (7.4%, a difference of 1.6%), and Paiute (7.1%, a difference of 1.8%).
| Demographics | Rating | Rank | Unemployment |
| Guyanese | 0.0 /100 | #322 | Tragic 6.9% |
| Immigrants | Grenada | 0.0 /100 | #323 | Tragic 6.9% |
| Immigrants | Armenia | 0.0 /100 | #324 | Tragic 7.0% |
| Natives/Alaskans | 0.0 /100 | #325 | Tragic 7.0% |
| Paiute | 0.0 /100 | #326 | Tragic 7.1% |
| Pueblo | 0.0 /100 | #327 | Tragic 7.2% |
| Tsimshian | 0.0 /100 | #328 | Tragic 7.2% |
| Alaska Natives | 0.0 /100 | #329 | Tragic 7.2% |
| Yakama | 0.0 /100 | #330 | Tragic 7.3% |
| Dominicans | 0.0 /100 | #331 | Tragic 7.4% |
| Sioux | 0.0 /100 | #332 | Tragic 7.4% |
| Immigrants | Dominican Republic | 0.0 /100 | #333 | Tragic 7.4% |
| Apache | 0.0 /100 | #334 | Tragic 7.4% |
| Alaskan Athabascans | 0.0 /100 | #335 | Tragic 7.7% |
| Immigrants | Yemen | 0.0 /100 | #336 | Tragic 7.7% |
Demographics Similar to Colombians by Unemployment
In terms of unemployment, the demographic groups most similar to Colombians are Immigrants from Indonesia (5.2%, a difference of 0.010%), Uruguayan (5.2%, a difference of 0.060%), Immigrants from Brazil (5.2%, a difference of 0.13%), Immigrants from Morocco (5.2%, a difference of 0.13%), and Immigrants from Zaire (5.2%, a difference of 0.24%).
| Demographics | Rating | Rank | Unemployment |
| Laotians | 66.3 /100 | #160 | Good 5.2% |
| Immigrants | Oceania | 65.2 /100 | #161 | Good 5.2% |
| Spanish | 65.1 /100 | #162 | Good 5.2% |
| Immigrants | Zaire | 64.7 /100 | #163 | Good 5.2% |
| Immigrants | Colombia | 64.7 /100 | #164 | Good 5.2% |
| Immigrants | Brazil | 63.1 /100 | #165 | Good 5.2% |
| Immigrants | Indonesia | 61.2 /100 | #166 | Good 5.2% |
| Colombians | 61.1 /100 | #167 | Good 5.2% |
| Uruguayans | 60.2 /100 | #168 | Good 5.2% |
| Immigrants | Morocco | 59.1 /100 | #169 | Average 5.2% |
| Immigrants | Nicaragua | 57.1 /100 | #170 | Average 5.2% |
| Puget Sound Salish | 56.6 /100 | #171 | Average 5.2% |
| Immigrants | Vietnam | 52.5 /100 | #172 | Average 5.2% |
| Immigrants | Poland | 51.8 /100 | #173 | Average 5.3% |
| Immigrants | Congo | 50.0 /100 | #174 | Average 5.3% |