Alaska Native vs South American Unemployment
COMPARE
Alaska Native
South American
Unemployment
Unemployment Comparison
Alaska Natives
South Americans
7.2%
UNEMPLOYMENT
0.0/ 100
METRIC RATING
329th/ 347
METRIC RANK
5.3%
UNEMPLOYMENT
33.9/ 100
METRIC RATING
192nd/ 347
METRIC RANK
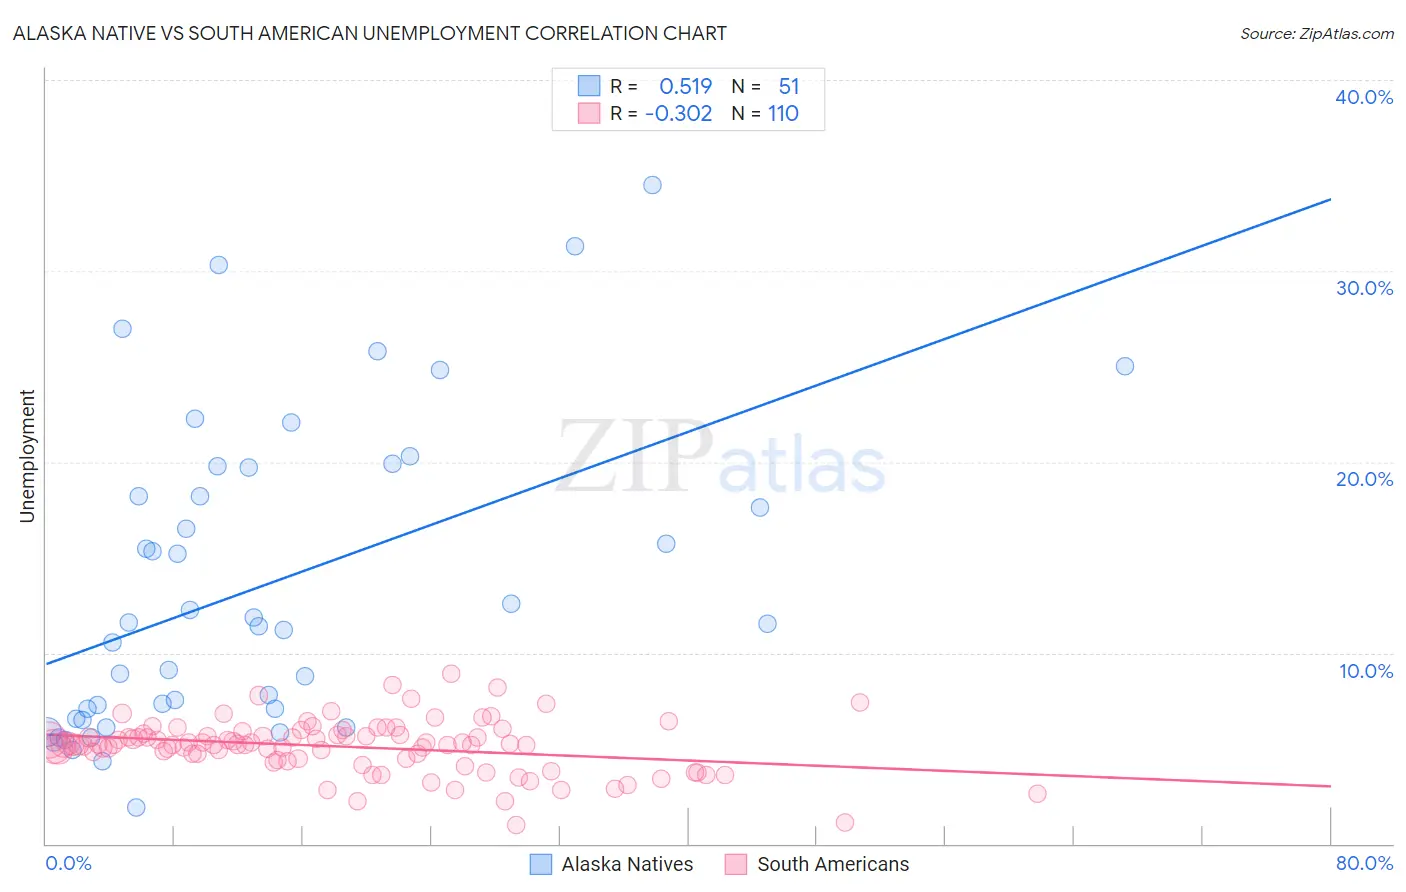
Alaska Native vs South American Unemployment Correlation Chart
The statistical analysis conducted on geographies consisting of 76,749,531 people shows a substantial positive correlation between the proportion of Alaska Natives and unemployment in the United States with a correlation coefficient (R) of 0.519 and weighted average of 7.2%. Similarly, the statistical analysis conducted on geographies consisting of 493,239,176 people shows a mild negative correlation between the proportion of South Americans and unemployment in the United States with a correlation coefficient (R) of -0.302 and weighted average of 5.3%, a difference of 36.3%.
Unemployment Correlation Summary
| Measurement | Alaska Native | South American |
| Minimum | 1.9% | 1.0% |
| Maximum | 34.5% | 8.9% |
| Range | 32.6% | 7.9% |
| Mean | 13.5% | 5.1% |
| Median | 11.5% | 5.2% |
| Interquartile 25% (IQ1) | 6.6% | 4.5% |
| Interquartile 75% (IQ3) | 19.7% | 5.7% |
| Interquartile Range (IQR) | 13.1% | 1.2% |
| Standard Deviation (Sample) | 8.0% | 1.4% |
| Standard Deviation (Population) | 8.0% | 1.4% |
Similar Demographics by Unemployment
Demographics Similar to Alaska Natives by Unemployment
In terms of unemployment, the demographic groups most similar to Alaska Natives are Tsimshian (7.2%, a difference of 0.31%), Pueblo (7.2%, a difference of 1.2%), Yakama (7.3%, a difference of 1.3%), Dominican (7.4%, a difference of 1.6%), and Paiute (7.1%, a difference of 1.8%).
| Demographics | Rating | Rank | Unemployment |
| Guyanese | 0.0 /100 | #322 | Tragic 6.9% |
| Immigrants | Grenada | 0.0 /100 | #323 | Tragic 6.9% |
| Immigrants | Armenia | 0.0 /100 | #324 | Tragic 7.0% |
| Natives/Alaskans | 0.0 /100 | #325 | Tragic 7.0% |
| Paiute | 0.0 /100 | #326 | Tragic 7.1% |
| Pueblo | 0.0 /100 | #327 | Tragic 7.2% |
| Tsimshian | 0.0 /100 | #328 | Tragic 7.2% |
| Alaska Natives | 0.0 /100 | #329 | Tragic 7.2% |
| Yakama | 0.0 /100 | #330 | Tragic 7.3% |
| Dominicans | 0.0 /100 | #331 | Tragic 7.4% |
| Sioux | 0.0 /100 | #332 | Tragic 7.4% |
| Immigrants | Dominican Republic | 0.0 /100 | #333 | Tragic 7.4% |
| Apache | 0.0 /100 | #334 | Tragic 7.4% |
| Alaskan Athabascans | 0.0 /100 | #335 | Tragic 7.7% |
| Immigrants | Yemen | 0.0 /100 | #336 | Tragic 7.7% |
Demographics Similar to South Americans by Unemployment
In terms of unemployment, the demographic groups most similar to South Americans are Somali (5.3%, a difference of 0.0%), Immigrants from Somalia (5.3%, a difference of 0.010%), Arab (5.3%, a difference of 0.090%), Immigrants from Belarus (5.3%, a difference of 0.11%), and Alsatian (5.3%, a difference of 0.21%).
| Demographics | Rating | Rank | Unemployment |
| Immigrants | Thailand | 38.9 /100 | #185 | Fair 5.3% |
| Immigrants | Uganda | 37.8 /100 | #186 | Fair 5.3% |
| Costa Ricans | 37.4 /100 | #187 | Fair 5.3% |
| Alsatians | 37.0 /100 | #188 | Fair 5.3% |
| Immigrants | Belarus | 35.6 /100 | #189 | Fair 5.3% |
| Arabs | 35.3 /100 | #190 | Fair 5.3% |
| Somalis | 34.0 /100 | #191 | Fair 5.3% |
| South Americans | 33.9 /100 | #192 | Fair 5.3% |
| Immigrants | Somalia | 33.8 /100 | #193 | Fair 5.3% |
| Immigrants | Laos | 30.9 /100 | #194 | Fair 5.3% |
| Immigrants | Southern Europe | 30.9 /100 | #195 | Fair 5.3% |
| Peruvians | 29.9 /100 | #196 | Fair 5.3% |
| Immigrants | Uruguay | 29.8 /100 | #197 | Fair 5.3% |
| Immigrants | Israel | 28.6 /100 | #198 | Fair 5.3% |
| Immigrants | Afghanistan | 28.6 /100 | #199 | Fair 5.3% |